cpuprofilify 
Converts output of various profiling/sampling tools to the .cpuprofile format so it can be loaded into Chrome DevTools.
Table of Contents generated with DocToc
Installation
npm install -g cpuprofilify
Instructions
cpuprofilify installs two binary scripts:
-
profile_1ms.d: DTrace script that samples your process, use either of the following to generate a tracesudo profile_1ms.d -c <command> | cpuprofilify > out.cpuprofilesudo profile_1ms.d -p <process id> | cpuprofilify > out.cpuprofile
-
cpuprofilify: which will convert a perf or DTrace trace into a.cpuprofileimportable into Chrome DevTools
Example
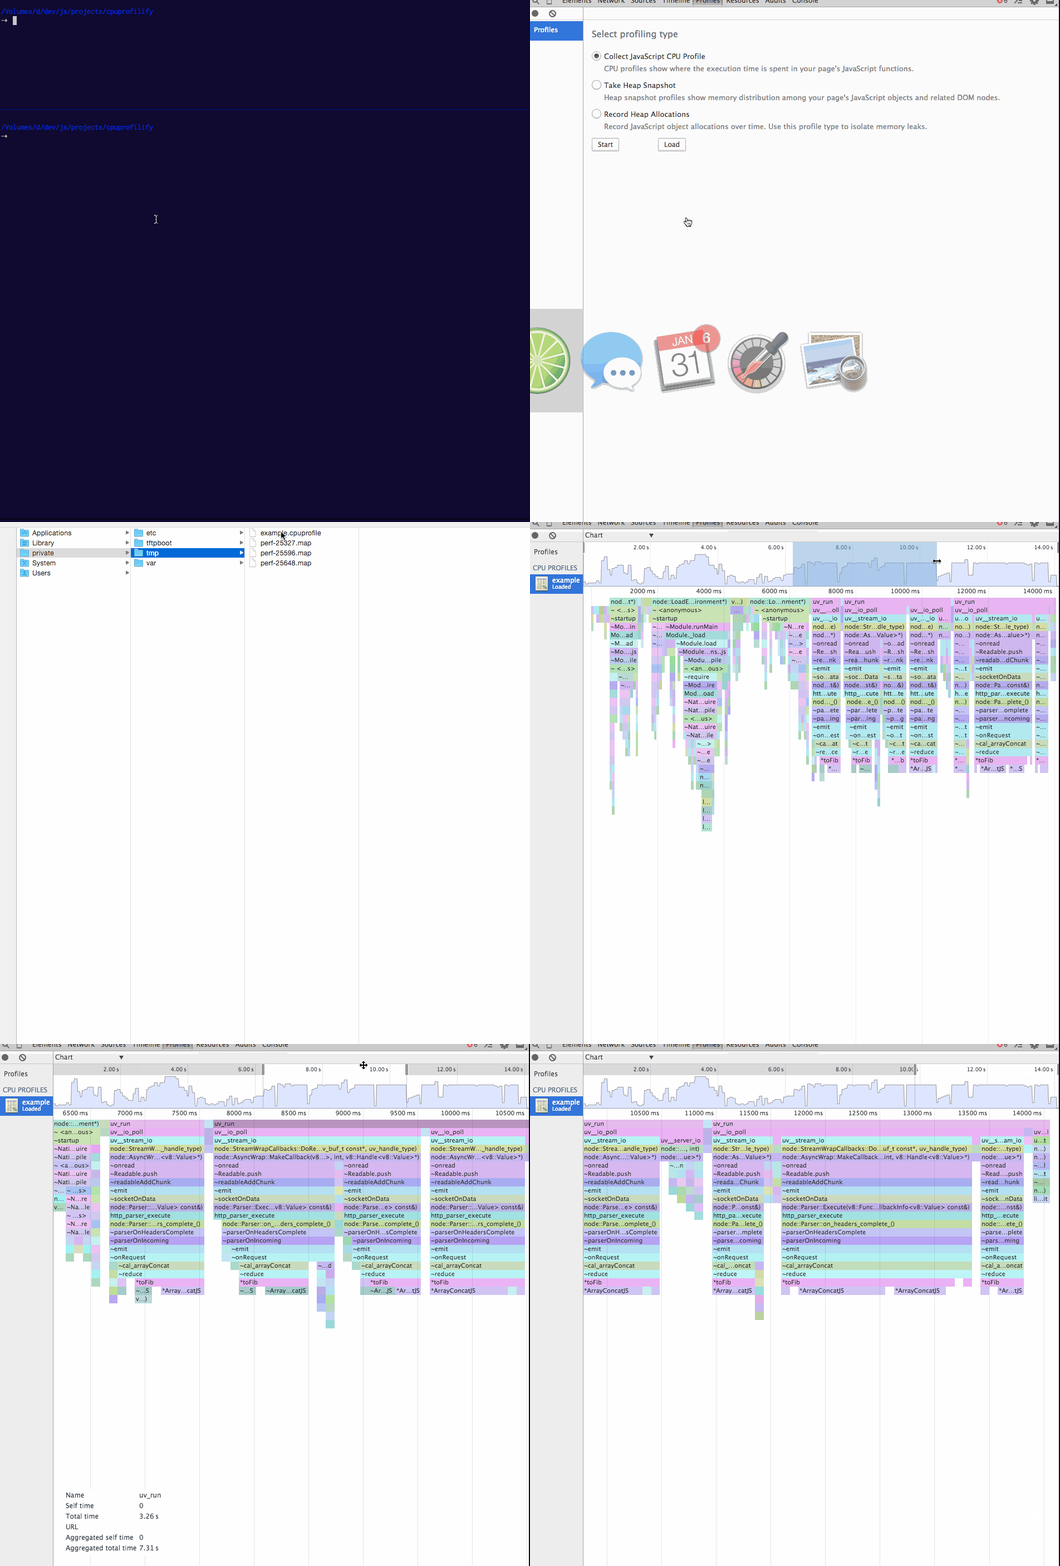
using DTrace script
# In Terminal A
➝  sudo profile_1ms.d -c 'node --perf-basic-prof example/fibonacci' | \
      cpuprofilify > /tmp/example.cpuprofile
pid <process-pid>
HTTP server listening on port 8000

# In Terminal B
➝  ab -n 6 -c 2 http://:::8000/1000/
This is ApacheBench, Version 2.3 <$Revision: 1554214 $>
Copyright 1996 Adam Twiss, Zeus Technology Ltd, http://www.zeustech.net/
Licensed to The Apache Software Foundation, http://www.apache.org/

Benchmarking :: (be patient).....done
[ .. ]

➝  sudo kill <process-pid>
Now open /tmp/example.cpuprofile in Chrome DevTools Profiles - Load
NOTE: in order to try the above example please clone this repository.
Usage
cat trace.txt | cpuprofilify <options> > my.cpuprofile

  Converts the given trace taking according to the given opttions


OPTIONS:

--unresolveds  , --nounresolveds    unresolved addresses like `0x1a23c` are filtered from the trace unless this flag is set (default: false)
--sysinternals , --nosysinternals   sysinternals like `__lib_c_start...` are filtered from the trace unless this flag is set (default: false)
--v8internals  , --nov8internals    v8internals like `v8::internal::...` are filtered from the trace unless this flag is set (default: false)
--v8gc         , --nov8gc           when v8internals are filtered, garbage collection info is as well unless this flag set  (default: true)

--shortStack      , --noshortStack        stacks that have only one line are ignored unless this flag is set (default: false)
--optimizationinfo, --nooptimizationinfo  JS optimization info is removed unless this flag is set (default: false)


--type                              type of input `perf|dtrace|instruments`. If not supplied it will be detected.
--help                              print this help

EXAMPLE:

  Generate cpuprofile from DTrace data with default options
  using higher switchrate in order to deal with large amount of data being emitted

    sudo profile_1ms.d -x switchrate=1000hz  -c <command> | cpuprofilify > out.cpuprofile

  Generate cpuprofile from DTrace data with default options keeping v8 internals

    sudo profile_1ms.d -c <command> | cpuprofilify --v8internals > out.cpuprofile

  Generate cpuprofile from DTrace data with default options filtering v8 gc events

    sudo profile_1ms.d -c <command> | cpuprofilify --nov8gc > out.cpuprofile
cpuprofilify and perf
use this on any system that doesn't have DTrace, but perf instead like Linux
perf record -e cycles:u -g -- node --perf-basic-prof myapp.js
perf script | cpuprofilify > out.cpuprofile
API
-
CpuProfilifier()
-
Creates new CpuProfilifier
-
CpuProfilifier::convert(trace, opts) → {Object}
-
Converts the given trace taking according to the given opts.
var cpuprofilifier = require('cpuprofilifier');
var cpuprofile = cpuprofilifier().convert(trace);
fs.writeFileSync('/tmp/my.cpuprofile', JSON.stringify(cpuprofile));
Parameters:
Name Type Argument Description traceArray.<String> a trace generated via
perf scriptor theprofile_1ms.dDTrace scriptoptsObject <optional>
Properties
Name Type Description mapstring a map containing symbols information, if not given it will be read from /tmp/perf-.map.
typestring type of input
perf|dtrace|instruments. If not supplied it will be detected.shortStackBoolean stacks that have only one line are ignored unless this flag is set
optimizationinfoBoolean JS optimization info is removed unless this flag is set (default: false)
unresolvedsBoolean unresolved addresses like
0x1a23care filtered from the trace unless this flag is set (default: false)sysinternalsBoolean sysinternals like
__lib_c_start...are filtered from the trace unless this flag is set (default: false)v8internalsBoolean v8internals like
v8::internal::...are filtered from the trace unless this flag is set (default: false)v8gcBoolean when v8internals are filtered, garbage collection info is as well unless this flag set (default: true)
Returns:
an cpuprofile presentation of the given trace
- Type
- Object
generated with docme
License
MIT


