net-monitor
In a nutshell:
Live demo
Two live demos displaying the ingress and egress throughputs of my ADSL box at home are available here:
-
blank background, 120 seconds displayed: https://fenyo.net/newweb/net-monitor/freebox-outside-white.html
-
black background, 30 seconds displayed: https://fenyo.net/newweb/net-monitor/freebox-outside-black.html
Run in JSFiddle with live data: https://jsfiddle.net/jsfiddleeowyn/1cu172ya/
See a short video of net-monitor running on a small display based on a Raspberry Pi in kiosk mode: https://fenyo.net/newweb/net-monitor/net-mon-on-rpi.mp4
Purpose
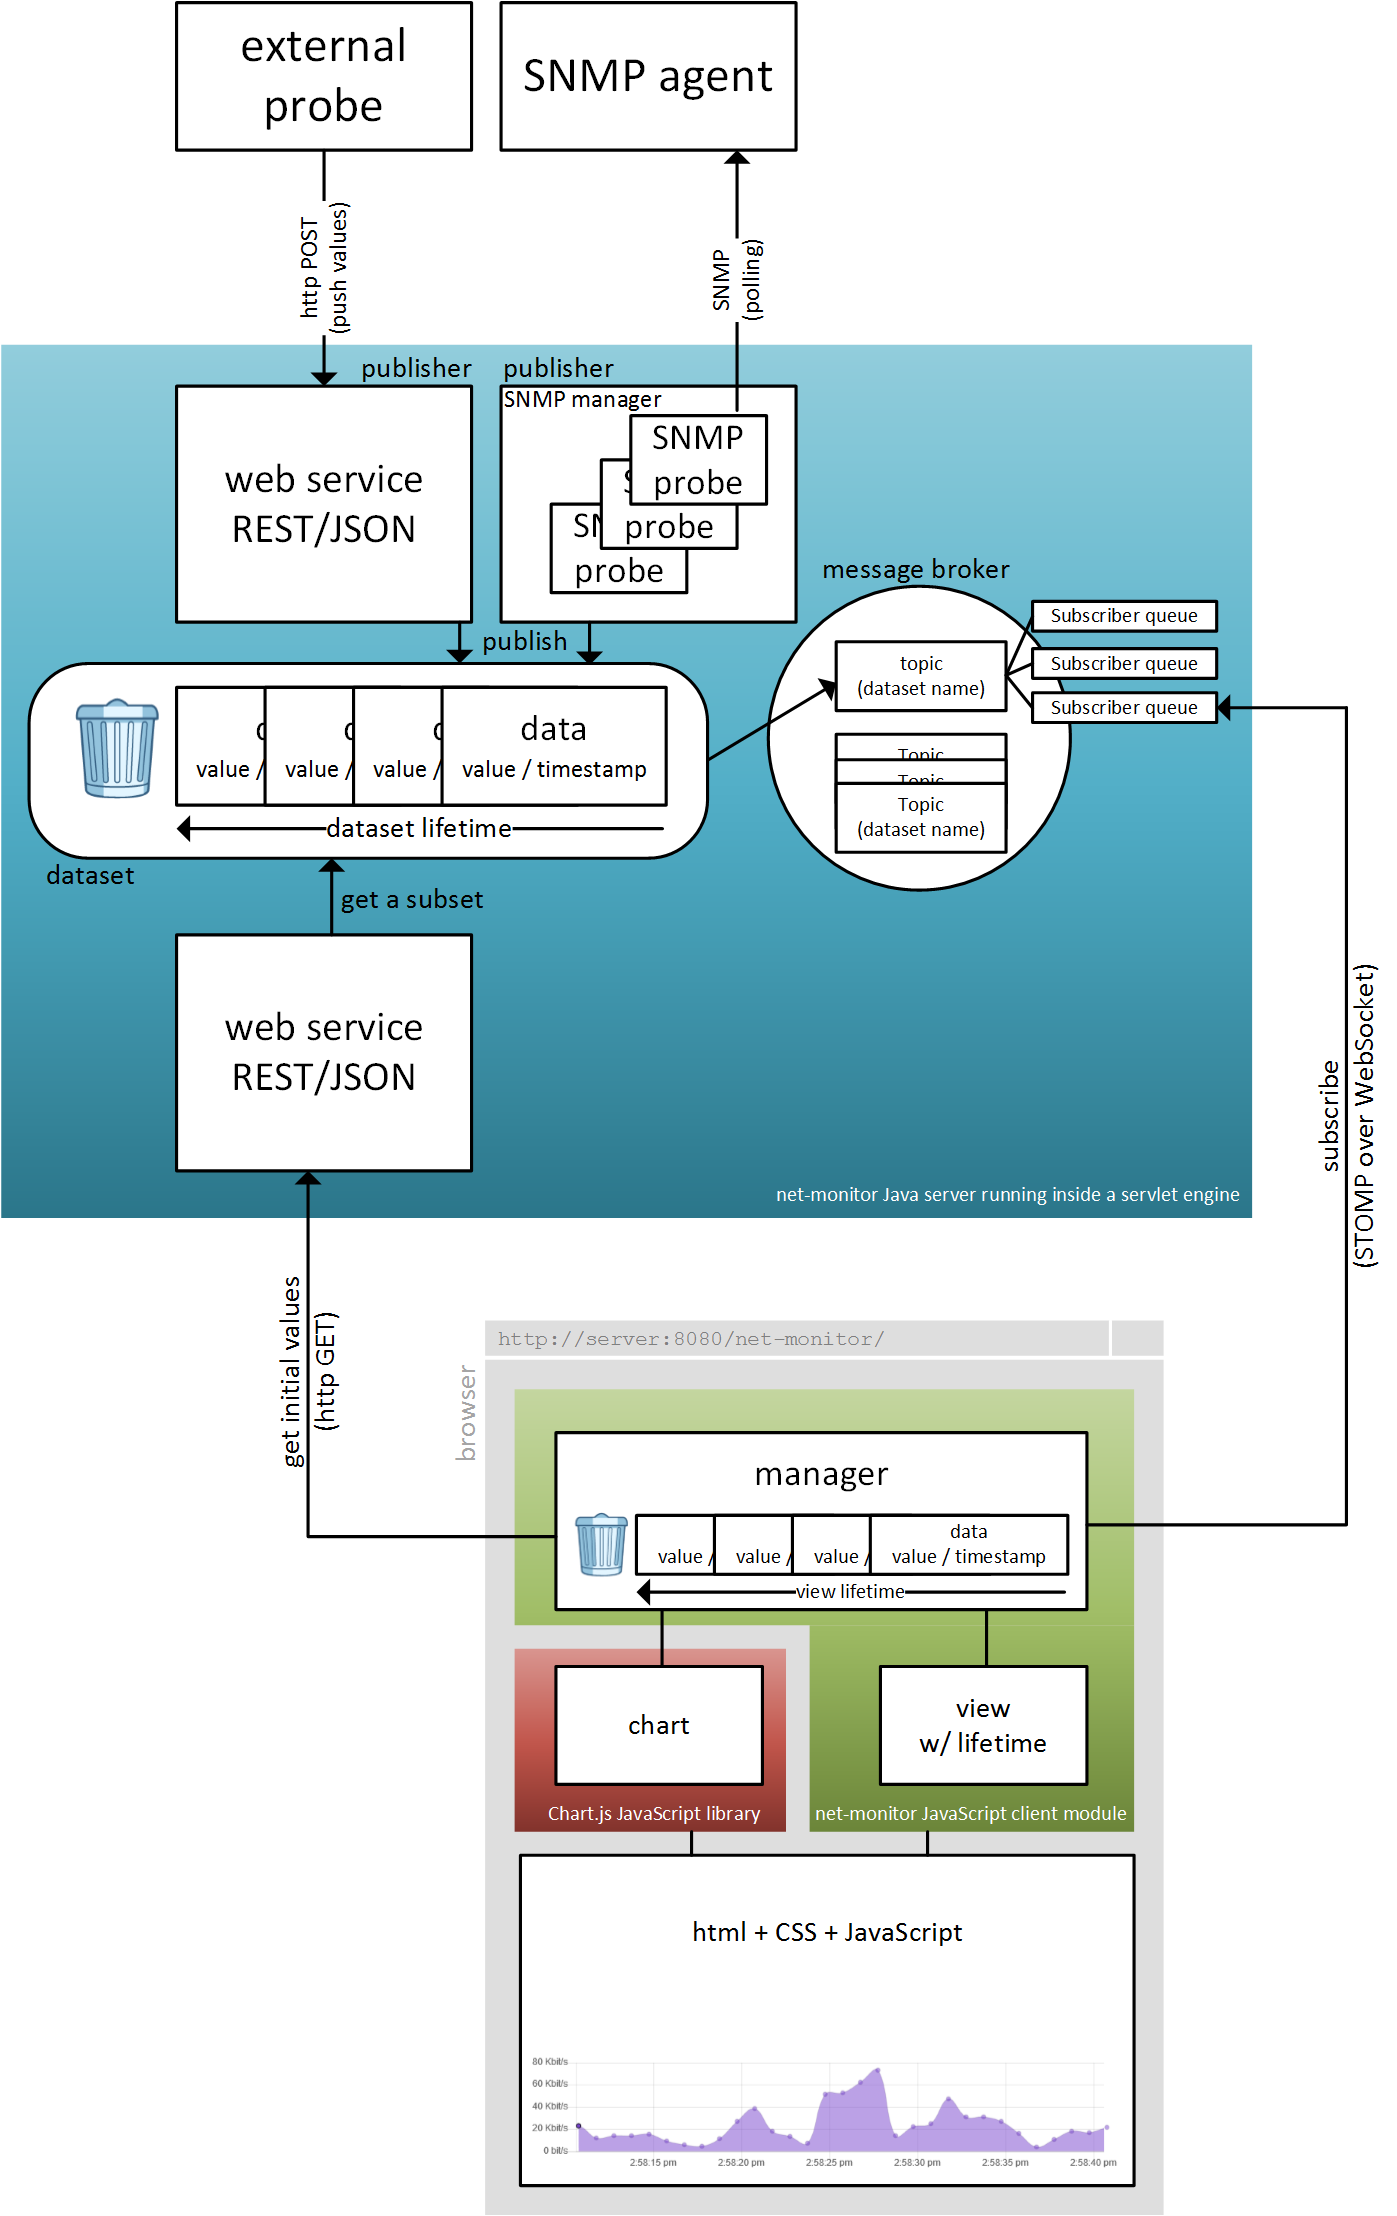
net-monitor is a client / server toolkit. Its purpose is to let you include HTML animated networking charts into your web applications and single pages. It comes with a SNMP v1/v2c/v3 manager and is fully compliant with IPv4 & IPv6.
It is made of two main parts:
- a JavaScript client library (module): net-monitor.bundle.min.js;
- a server running in a servlet container, that collects data and feeds the client library with them.
The implementation is very efficient: clients (i.e. browsers) do not poll the server. Instead, clients subscribe to their desired topics (data sets) from a message broker, on top of WebSockets.
Therefore, a very large number of clients can be connected to the same server without performance issues.
Concepts
Before using net-monitor, you may start reading this chapter to get informations about its core concepts: data sets, probes, charts, views, managers and lifetime configuration.
data set
A net-monitor data set is a named time series (i.e. a set of time stamped collected data), maintained in the net-manager server memory. A data set typically contains numerical network throughput values collected from a snmp agent. A maximum data lifetime is associated with each data set.
The only way to create a new data set is to add a value to a named data set that has not already been created. Only probes (see below) can add a value to a data set, therefore only probes can create a new data set.
For integrity purpose, data sets can only be updated by one of the following two mecanisms:
-
A new data value, timestamped with the current instant (corresponding to the instant the data is added into the server memory), can be added by a net-monitor probe (typically using its internal snmp manager) or by an external web service request to the server (the client browser can act as an external probe while calling
NetMonitor.pushValue(...)).No data can be added with a timestamp in the past or the future. Therefore, the probe or the web service request that adds a new data does not need to specify a timestamp.
-
When two data values become older than the data set lifetime, the oldest one is removed. Therefore, there can only be one data value older that the data set lifetime, at most.
Keeping one data value older than the lifetime of the data set is useful to correctly draw a line chart representing the data set over its life time: to draw the first segment, having a timestamped value outside the canvas is necessary.
To sum up, a data set has a name, a life time and contains a set of timestamped data, maintained in the net-monitor server memory. It is created by a probe, when adding a new value to a named dataset not already instanciated.
probe
A probe collects real-time data and pushes them to its associated data set.
There are two probe types:
-
internal probes:
Such a probe runs in the net-monitor server and is associated to a data set. Each time it collects a data, this data is pushes into the data set. There is currently one type of internal probe: SNMP probes, that collect network interfaces throughput.
Internal probes are configured with a constant lifetime, that is the lifetime they specify when pushing a data to the data set. It is a static value that must be greater or equal to 0 second, or -1 to refer to the global default lifetime configured in the server.
-
external probes:
External probes can run anywhere, they just invoke a REST/JSON web service on the server to push some real-time data to a data set.
External probes may choose to specify a lifetime when pushing a data to a data set. This lifetime can change over the time. Not specifying a lifetime or specifying 0 means that in case the dataset already exists, no change for its lifetime is requested. I the dataset does not exist, its initial lifetime will be set to 0, therefore only one data value will be kept in this dataset until another lifetime is specified.
There are typically two types of external probes:
- daemons that collect data not available through SNMP and push them to the server,
- your JavaScript application running in the client browser and calling
NetMonitor.pushValue(...).
chart
A chart is a JavaScript object that the Chart.js JavaScript library uses to display time series using a html canvas.
view
A view (or chart view) is a net-monitor JavaScript object running in the browser, that associates a chart to a subset of a data set. This subset contains only the data with a timestamp in the range from now to the latest X seconds. X denotes the lifetime of the view, that must be greater than 0 second, and that corresponds to the time scale of x-axis of the view. There is a one-to-one association between a view and a chart.
manager
A manager is a net-monitor JavaScript object running in the browser, that lets you delegate the management of many couples of chart views and data sets. From the point of view of a manager, there is a one-to-one association between a chart view and a data set.
If you want to display multiple charts associated to the same data set, just create multiple managers. This may be useful to display different views of the same data set, for instance a short-range view populated with the last 60 seconds of data, and a long-range view populated the 2 last hours of data.
Here are the operations a manager does, when asked to manage a new chart:
-
The manager first creates the view and its associated chart.
-
The manager uses a WebSocket to connect to a message broker in the server, in order to subscribe to new data pushed into this dataset.
-
The manager connects again to the server and downloads, from this dataset, the data values that are not older than the lifetime defining the time scale of the view and, if available, one more data value in order to be able to draw the left-most segment of the graph. Therefore, the manager maintains a local copy of a subset of the data set.
-
Then the manager draws the values from this local copy on the chart.
-
Each time the manager receives a new value from the message broker, it adds the value to the locale copy of the data set and draws it on the chart.
-
Regularly, the manager moves the data displayed on the chart to the left, for the drawing to follow the x-axis time scale. If some data is no longer useful for drawing the chart, it is removed from the local copy of the dataset.
If you want to change the time scale displayed by a view with a chart, just ask the manager to unmanage the view and create a new manager to do the job again.
lifetime
Up to now, we have encountered four types of lifetime:
-
the global default lifetime configured in the server: used by the server when a lifetime value is needed and no one is given.
-
the lifetime associated to a data set maintained in the server: this value defines the duration before data are discarded from the data set (remember that a data set may contain at most one data older than the life time of the set).
-
the lifetime that a probe specifies when pushing a new value into a data set.
-
external probes: it can change over the time and must be greater or equal to 0, or omitted.
-
internal probes: it is a constant value greater or equal to 0 (-1 means global default lifetime).
-
-
the lifetime of a view, that is constant and defines the time range displayed by the corresponding chart. It should of course be greater or equal to the lifetime of the associated data set.
Here are the rules that define the life cycle of the dataset lifetime:
-
when a probe pushes a new value to a data set with a name not already associated to an existing one, a new data set is created with this new name. Its initial lifetime is the one specified by the probe for this value, or 0 if the probe has omitted to specify a lifetime.
-
when a probe pushes a new value to a data set that has already been created previously, and when that probe specifies a lifetime greater than the current data set lifetime, then the data set lifetime is updated (increased) to this new value. Otherwise, no change occurs to the data set lifetime.
Therefore, the data set lifetime can only be increased, decreasing it is forbidden. This rule is important to avoid views displaying a larger time scale than the available dataset range, after having changed the lifetime configuration of an external probe.
Here are the rules you must follow, to display data values correctly in every situations:
-
When you add a data value by means of an external probe, push the data with a lifetime that is greater than the greatest time scale among those of the views that already do or later will display the corresponding dataset.
-
When you configure an internal probe, associate with it a lifetime that is greater than the greatest time scale among those of the views that already do or later will display the corresponding dataset.
Server configuration
There are two configuration files for the server side:
- log4j.xml: logging rules file. Optional (there is a default one).
- config.json: general properties and SNMP manager configuration file. Mandatory.
Installing configuration files
Depending on the installation way (with Docker, from the WAR archive, from the sources, ...), you need to find the correct way to feed the server with the configuration files. See the Server installation chapter to find the specific way to do that.
writing configuration files
log4j.xml
The default logging rules configuration file looks like this:
<log4j:configuration xmlns:log4j="http://jakarta.apache.org/log4j/">

	<!-- Appenders -->
	<appender name="console" class="org.apache.log4j.ConsoleAppender">
		<param name="Target" value="System.out" />
		<layout class="org.apache.log4j.PatternLayout">
			<param name="ConversionPattern" value="%-5p: %d %c - %m%n" />
		</layout>
	</appender>

	<!-- Application Loggers -->
	<logger name="net.fenyo">
		<level value="info" />
	</logger>

	<!-- Root Logger -->
	<root>
		<priority value="warn" />
		<appender-ref ref="console" />
	</root>

</log4j:configuration>
Note that if you set a configuration that generates a high log rate, you should remove the %d part of the ConversionPattern because of performances issues with the SimpleDateFormat implementation of the standard JDK: for better results it is recommended to use the log4j date formatters.
If you want to inspect / debug the net-monitor behaviour, replace the level value for the net.fenyo logger by debug.
If you want to inspect / debug the other components (Spring MVC, WebSocket implementation, STOMP message broker, ...), replace the priority value for the root Logger by something like info or debug.
config.json
The config.json contains the whole server configuration in JSON file format (RFC-7159).
The default lifetime is specified in the default_lifetime property.
The internal probes are specified as an array of probe configuration parts, in the probes property.
{
	"default_lifetime": 86400,
	"probes": [ ... ]
}
There is currently 3 types of internal probes:
- SNMPv1
- SNMPv2c
- SNMPv3
Here are the mandatory keys for any SNMP probe: dataset, lifetime, type, version, agent, oid and rate.
- dataset: data set name
- lifetime: lifetime used when a data value collected from this probe is pushed to the data set
- type: must be
snmp - version: must be
v1,v2corv3, depending on the SNMP version of the agent - agent: DNS name, IPv4 address or IPv6 address of the agent
- OID: an OID of type Counter like IF-MIB::ifInOctets.[INTERFACE_INDEX] or IF-MIB::ifOutOctets.[INTERFACE_INDEX]
- rate: the rate (unit: per seconds) at which the manager probes the agent to look for a new value
The rate should be about ten times the update rate of the OID value, for the manager to collect the data just when it changes. This is important since net-monitor computes throughputs by dividing by the delay the difference between this new value and the previous one. Therefore, the computed delay must be accurate to get a correct throughtput value.
For SNMPv1 probes, one more key / value is needed, to specify the community.
Therefore, here is an example of a SNMPv1 probe:
{
  "dataset": "set1",
  "lifetime": 3600,
  "type": "snmp",
  "version": "v1",
  "agent": "10.69.127.247",
  "community": "public",
  "oid": "1.3.6.1.2.1.2.2.1.10.10101",
  "rate": 10
}
Here is an example of a SNMPv2c probe:
{
  "dataset": "set1",
  "lifetime": 3600,
  "type": "snmp",
  "version": "v2c",
  "agent": "10.69.127.247",
  "community": "public",
  "oid": "1.3.6.1.2.1.2.2.1.10.10101",
  "rate": 10
}
With SNMPv3 probes, you must not set a community secret but specify a username, a security level and, depending on this level, some algorithms and some secrets.
First, define a username as a value for the key username, then define a value for the key sec_level, among noAuthNoPriv, authNoPriv and authPriv.
With authNoPriv and authPriv, you must define:
- a value for the key
auth_algo, amongMD5,SHA128,SHA224,SHA256,SHA384andSHA512 - a value for the key
password_auth
With authPriv, you must also define:
- a value for the key
auth_priv, amongDES,3DES,AES128,AES192andAES256. - a value for the key
password_priv
Note that one username must have the same auth and priv secrets on every SNMP agents.
Here is an example of a configuration file with 3 probes: two SNMP v2c and one v3:
{
	"default_lifetime": 86400,
	"probes": [
		{
			"dataset": "set1",
			"lifetime": 3600,
			"type": "snmp",
			"version": "v3",
			"username": "user4",
			"sec_level": "authPriv",
			"auth_algo": "MD5",
			"priv_algo": "DES",
			"agent": "10.69.127.247",
			"password_auth": "password1234",
			"password_priv": "password1234",
			"oid": "1.3.6.1.2.1.2.2.1.10.10105",
			"rate": 10
		},
		{
			"dataset": "set2",
			"lifetime": 3600,
			"type": "snmp",
			"version": "v2c",
			"agent": "10.69.127.248",
			"community": "public",
			"oid": "1.3.6.1.2.1.2.2.1.10.10101",
			"rate": 10
		},
		{
			"dataset": "set3",
			"lifetime": 3600,
			"type": "snmp",
			"version": "v2c",
			"agent": "10.69.127.248",
			"community": "public",
			"oid": "1.3.6.1.2.1.2.2.1.16.10101",
			"rate": 10
		}
	]
}
Client API
Creating a chart
See below the chapter Client integration and choose a way to import the net-monitor JavaScript module (script tag, ES6 module, common JS, ...).
We suppose here that you have imported this module as the named object NetMonitor, the following way for instance:
<script src="javascript/public/net-monitor.bundle.min.js"></script>To create and manage a chart, you first need to declare an html canvas with an id, like you would do with Chart.js.
We suppose here that you have created the following two charts:
<canvas id="myChart1" width="800" height="200"></canvas>
<br/>
<canvas id="myChart2" width="800" height="200"></canvas>
Configuration object
To manage these canvas, you must not call the Chart.js API but the net-monitor one. As said before, a manager can handle several charts, using views. So you need to create a configuration object that defines global parameters for this manager, and an array of views.
global parameters
Here are the global parameters:
dispatchUrl (optional): this parameter is used to help the browser locate the dispatch servlet in the net-monitor server when the base URL (http[s]://[hostname]:[port]/[context]) of the web page that makes use of net-monitor is not the same that the base URL of the server side of net-monitor. This dispatch servlet is used to access web sockets and web services on the server.
For instance, suppose that the html page using net-monitor has been loaded from http[s]://[hostname]:[port]/[local-part] (ex: https://myserver.com:4443/myapp/app.html). When dispatchUrl is not used, the net-monitor JavaScript client computes the server URL using the protocol, hostname and port from the URL of the page, adds the context /net-monitor/ and finally adds the servlet name dispatch. Therefore, this lead to https://myserver.com:4443/net-monitor/dispatch. In case the net-monitor server is published at another URL, for instance http://myotherserver:8080/net-monitor, you must set dispatchUrl to http://myotherserver:8080/net-monitor/dispatch.
dispatchUrlWebSocket (optional): this parameter is used to let the net-monitor client library connect to the dispatch servlet web socket with a distinct URL that the one used to connect to the dispatch servlet web services. This is typically useful when using a reverse proxy in front of the dispatch servlet and this reverse proxy does not support web sockets.
views
Each view associates a dataset with a canvas id and some more parameters:
- the lifetime the view must display (unit: seconds),
- the top label (optional),
- the bottom label (optional).
For instance, here is a view displaying the last minute values of the server data set named set1, on the canvas with id myChart1:
{
	id: "myChart1",
	topLabel: "chart 1: last 60 seconds of data set 1",
	bottomLabel: "dataset 1",
	lifeTime: 60,
	dataSet: "set1"
}
full example
Here is an example of a configuration object used to manage both of the charts myChart1 and myChart2 we have talked about before:
var charts_conf = {
		// optional URL to access the dispatch servlet:
		dispatchUrl: "http://my-server.com:8080/net-monitor/dispatch",
		views: [
			{
				id: "myChart1",
				topLabel: "chart 1: last 60 seconds of data set 1",
				bottomLabel: "dataset 1",
				lifeTime: 60,
				dataSet: "set1"
			},
			{
				id: "myChart2",
				topLabel: "chart 2: last 30 seconds of data set 2",
				bottomLabel: "dataset 2",
				lifeTime: 30,
				dataSet: "set2"
			}
		]
};
Managing a chart
create a manager
To create a manager that handles the views defined in a configuration object, just call Manager.manage(charts_conf). This will return a manager object, that can later be used to process different actions.
This new manager creates the chart, displays initial values and manages new values.
Manager.manage(...) is typically called when the page is loaded.
example
<!DOCTYPE html>
<html>
  <head>
    <meta charset="UTF-8">
    <title>two animated graphs with net-monitor</title>
    <script src="javascript/public/net-monitor.bundle.min.js"></script>
    <script>
      var charts = {
		// optional URL to access the server:
		// dispatchUrl: "http://localhost:8080/net-monitor/dispatch",
		views: [
			{
				id: "myChart1",
				topLabel: "chart 1: last 60 seconds of data set 1",
				bottomLabel: "dataset 1",
				lifeTime: 60,
				dataSet: "set1"
			},
			{
				id: "myChart2",
				topLabel: "chart 2: last 30 seconds of data set 2",
				bottomLabel: "dataset 2",
				lifeTime: 30,
				dataSet: "set2"
			}
		]
    };
    var manager;
    </script>
  </head>
  <body onload="manager=NetMonitor.manage(charts)">
    <canvas id="myChart1" width="800" height="200"></canvas>
    <canvas id="myChart2" width="800" height="200"></canvas>
  </body>
</html>
Unmanaging a chart
Simply call NetMonitor.unmanage(manager) to unmanage the chart. This will destroy the Chart.js chart instances (the charts disappear), close the web socket to the server and clean associated data.
Using the browser as an external probe
You can push a value to a data set with a call to NetMonitor.pushValue(manager, dataSet, value, lifeTime, callbackDone).
Arguments:
- manager: the manager that manages a view associated to the data set on which the value must be pushed,
- dataSet: the data set name,
- value: a numeric value corresponding to a throughput,
- lifeTime (optional): lifeTime for this value,
- callbackDone: a callback function called by the manager when the value is added to the data set.
Here is an example of a html button adding the value 123 to a chart and logging a message to the browser console when it is done:
<button onclick="NetMonitor.pushValue(manager, 'set1', 123, undefined, function () {console.info('value pushed')})">add 123 to set1</button>Customizing a chart
The Chart.js configuration properties can be accessed directly using NetMonitor.getChart(manager, dataSet).
Here is an example of a chart customization:
#set border color to mauve
NetMonitor.getChart(manager, 'set1').data.datasets[0].borderColor = Color("#7743CE").alpha(.8).rgbString();
#set background color to black
NetMonitor.getChart(manager, 'set1').data.datasets[0].backgroundColor = Color("#0000").rgbString();
#remove the legend
NetMonitor.getChart(manager, 'set1').options.legend.display = false;
#change the grid color to white
NetMonitor.getChart(manager, 'set1').options.scales.xAxes[0].gridLines.color = Color("#FFFFFF").rgbString();
NetMonitor.getChart(manager, 'set1').options.scales.yAxes[0].gridLines.color = Color("#FFFFFF").rgbString();
#use straight lines instead of curve ones
NetMonitor.getChart(manager, 'set1').data.datasets[0].lineTension = 0;
Server installation
The net-monitor server is made of three components:
- a REST/JSON web-services server
- a STOMP message broker over RFC-6455 WebSocket technology
- a SNMP v1/v2c/v3 manager
All these components are packaged in a single servlet that needs a servlet container to run into. Tomcat is the prefered container for this purpose.
This servlet is requested by the net-monitor JavaScript client library.
Install with Docker
Using Docker is the prefered way to install net-monitor.
download the image
Before running a container with the net-monitor image, you may pull the latest image from DockerHub. Anyway, running a container with this image will fetch the image if not already pulled.
user% docker pull fenyoa/net-monitorrun a container
Before running a container, fetch the following informations:
-
the TCP port number you want the servlet container to listen to: you will have to forward this port to the port 8080 inside the container
-
the config.json configuration file: you will have to map this file to the container root directory (
/, not/root) -
optionally, the log4j.xml logging rules file: you may map this file to the container root directory (
/, not/root)
Suppose you have chosen port 8888.
You can now run the container this way, in foreground:
user% docker run --rm -t -i -p 8888:8080 -v $PWD/net-monitor/config.json:/config.json -v $PWD/net-monitor/log4j.xml:/log4j.xml fenyoa/net-monitorYou can run the container this way, in the background (detached mode):
user% docker run -d -p 8888:8080 -v $PWD/net-monitor/config.json:/config.json -v $PWD/net-monitor/log4j.xml:/log4j.xml fenyoa/net-monitorInstall from the WAR archive in the Cloudflare CDN
base URL
The Cloudflare base URL that contains each build is https://eowyn.eu.org/cloudflare/
select the correct build
For compatibility purpose, the version of the net-monitor servlet must be the same as the version of the net-monitor JavaScript client library.
Therefore, when selecting the net-monitor-[VERSION].[standalone|bundle].[min|dev].js client library, choose the corresponding net-monitor-[VERSION].war web archive with the same version.
The latest web archive build corresponding to the latest client library build is https://eowyn.eu.org/cloudflare/net-monitor-latest.war
update the archive with the configuration file
Before pushing the net-monitor WAR archive in a servlet container, you must update the META-INF/config.json configuration file contained in the archive.
You do not need to explode the archive to do that, you can simply use jar to update the configuration file the following way (we suppose you have a configuration file named config.json and the WAR file in the current directory):
user% mkdir META-INF
user% cp config.json META-INF
user% jar uf net-monitor-*.war META-INF/config.json
user% rm -rf META-INF
update the archive with the logging rules
Before pushing the net-monitor WAR archive in a servlet container, you may want to update the WEB-INF/classes/log4j.xml logging rules file contained in the archive.
You do not need to explode the archive to do that, you can simply use jar to update the file the following way (we suppose you have a logging rules file named log4j.xml and the WAR file in the current directory):
user% mkdir -p WEB-INF/classes
user% cp log4j.xml WEB-INF/classes
user% jar uf net-monitor-*.war WEB-INF/classes/log4j.xml
user% rm -rf WEB-INF
run the server
Refer to your servlet container documentation (tomcat is a good choice) to find how to publish the net-monitor war file.
Install from the sources
See the chapter Build client library and server from the sources below to make a build.
Building with Linux + Maven, you will find the WAR archive here: net-monitor/target/net-monitor-*-SNAPSHOT.war
Building with Windows + Eclipse, you can use Eclipse to export the project as war to get the archive.
run the server
Refer to your servlet container documentation (tomcat is a good choice) to find how to publish the net-monitor war file.
SSL/https support
The easiest way to publish the server onto SSL/https is to add Apache httpd as a front-end for the Apache tomcat application server, and configure Apache httpd to listen to port 443 with a public certificate and a private key.
The communication protocol between those two components should be:
- AJP for everything but WebSocket connections,
- a transparent proxy for WebSocket connections.
Therefore, you need to configure the AJP TCP port used by Apache tomcat (for instance TCP/9001). For instance, when running Apache tomcat with maven, launch the following command with the AJP port as a parameter:
mvn -Dmaven.tomcat.ajp.port=9001 tomcat7:run
The http port tomcat7 listens to is defined in the pom.xml file (8080 by default).
On the Apache httpd side, you need to handle:
- requests to
/net-monitor/dispatch/socketwith the proxy_wstunnel module, - other requests to
/net-monitor/with AJP.
Here is a snippet of the httpd.conf configuration file:
#enable the websocket tunneling module
LoadModule proxy_wstunnel_module libexec/apache24/mod_proxy_wstunnel.so
#enable AJP
LoadModule proxy_ajp_module libexec/apache24/mod_proxy_ajp.so
#nested ProxyPass rules must be set in the correct order
ProxyPass "/net-monitor/dispatch/socket" "ws://127.0.0.1:8080/net-monitor/dispatch/socket"
ProxyPass "/net-monitor/" "ajp://127.0.0.1:9001/net-monitor/"
Redirect "/net-monitor" "/net-monitor/"
Client installation
Install from the JEE server
If you have installed the JEE server that comes with net-monitor, you already have installed the net-monitor client on it, and its dependencies.
Suppose that the server is running on host host and port port:
-
the bundle build is available on: http(s)://host:port/net-monitor/javascript/public/net-monitor.bundle.min.js
-
the standalone build is available on: http(s)://host:port/net-monitor/javascript/public/net-monitor.standalone.min.js
-
the dependencies, for use with the standalone build, are available on:
http(s)://host:port/net-monitor/jquery/dist/jquery.min.js
http(s)://host:port/net-monitor/moment/moment.js
http(s)://host:port/net-monitor/webstomp-client/dist/webstomp.min.js
http(s)://host:port/net-monitor/chart.js/dist/Chart.bundle.min.js
Install from the npmjs repository
package managers
You can install net-monitor from the npmjs repository using your favorite package manager: npm or yarn (avoid using bower for new client side modules). This will install net-monitor and its dependencies.
You can also access the dedicated page on npmjs: https://www.npmjs.com/package/@fenyo/net-monitor
npm
npm install @fenyo/net-monitor --save
yarn
yarn add @fenyo/net-monitor
select the correct build
There are two different builds available:
-
A bundle build with dependencies:
src/main/javascript/public/net-monitor.bundle.min.js -
A standalone build:
src/main/javascript/public/net-monitor.standalone.min.js
Install from the Cloudflare CDN
base URL
The Cloudflare base URL that contains each build is https://eowyn.eu.org/cloudflare/
select the correct build
-
Standalone builds are available using this template: net-monitor-[VERSION].standalone.min.js
Example: https://eowyn.eu.org/cloudflare/net-monitor-1.0.10.standalone.min.js
The latest standalone build is https://eowyn.eu.org/cloudflare/net-monitor-latest.standalone.min.js
-
Bundle builds are available using this template: net-monitor-[VERSION].bundle.min.js
Example: https://eowyn.eu.org/cloudflare/net-monitor-1.0.10.bundle.min.js
The latest bundle build is https://eowyn.eu.org/cloudflare/net-monitor-latest.bundle.min.js
Install from the sources
See the chapter Build client library and server from the sources below to make a build, then fetch the JavaScript builds from the repository src/main/javascript/public
Client integration
net-monitor can be integrated with plain JavaScript or with different module loaders, into your web application. The examples below show how to load net-monitor in different systems.
script tag with bundle build
<script src="javascript/public/net-monitor.bundle.min.js"></script>
<script>
    var charts = { ... };
    var manager = NetMonitor.manage(charts);
</script>
script tag with standalone build
Note that the dependencies are also installed on the server.
<script src="jquery/dist/jquery.min.js"></script>
<script src="moment/moment.js"></script>
<script src="webstomp-client/dist/webstomp.min.js"></script>
<script src="chart.js/dist/Chart.bundle.min.js"></script>
<script src="javascript/public/net-monitor.standalone.min.js"></script>
<script>
    var charts = { ... };
    var manager = NetMonitor.manage(charts);
</script>
ES6 module
import NetMonitor from "@fenyo/net-monitor";
var charts = { ... };
var manager = NetMonitor.manage(charts);
common JS
var NetMonitor = require("@fenyo/net-monitor");
var charts = { ... };
var manager = NetMonitor.manage(charts);
Build client library and server from the sources
If you want to contribute to net-monitor, you can build the client and server software from the sources with the following recipes.
Linux + Maven
first installation
Note: this example is for Linux Ubuntu 16.04 LTS.
-
Download the sources
Download from github:
user% git clone https://github.com/AlexandreFenyo/net-monitor.git -
JavaScript part (client module for use in browsers):
-
Install a recent version of Node.js:
-
Bind to a recent node repository:
root# curl -sL https://deb.nodesource.com/setup_8.x | sudo -E bash - -
Install node from this repository:
root# apt-get install nodejsNote 1: if you do not bind to a recent repository, the node version installed may be too much older to work correctly.
Note 2: a recent version of npm has been installed, as a dependency of this recent Node.js.
-
-
Populate JavaScript module dependencies into
node_modulesrepository:user% npm install -D -
Use webpack and Babel to transpile, add polyfill, minify and package the JavaScript module:
user% npx webpackThis will create
src/main/javascript/public/net-monitor/net-monitor.min.jsfromsrc/main/javascript/src/net-monitor.jsand relative dependencies innode_modules
-
-
Java EE part (application server):
-
Install a recent JDK to build the JEE application:
root# apt-get install openjdk-8-jdk -
Install maven:
root# apt-get install maven -
Build with maven:
user% mvn clean installThe generated WAR file is built here:
net-monitor/target/net-monitor-0.0.1-SNAPSHOT.war -
Run this application with tomcat:
user% mvn tomcat7:run-war
-
-
Access to the generated resources:
-
Now, you can access the demo application on: http://localhost:8080/net-monitor
From a remote host, use: http://HOSTNAME:8080/net-monitor
-
The module is available here: http://HOSTNAME:8080/net-monitor/javascript/public/net-monitor.min.js
-
updates
After having updated some source files, just run the following command lines to take updates into account:
user% npx webpack
user% mvn compile install
user% mvn tomcat7:run-war
Windows + Eclipse
install Eclipse
The sources available from GitHub can be imported in Eclipse as a project with Spring MVC and Maven natures.
Follow these instructions:
- a recent JDK (1.8.x or higher)
- a version of Eclipse (Neon.3 or higher) including STS (Spring Tools)
- add a tomcat (8.x or higher) server to Eclipse:
- in Eclipse IDE, go to menu Window > Preferences.
- expand the Server > Runtime Environments node in the Preferences dialog.
- click Add… to add a new server runtime environment.
- In the New Server Runtime Environment dialog, select Apache > Apache Tomcat v... (the latest version of Tomcat to date) and check the option Create a new local server
Now, go to menu File > Import, choose Projects from Git and clone net-monitor from https://github.com/AlexandreFenyo/net-monitor.git
Finally, publish the net-monitor project into the tomcat server: open the Servers view, select the server, right click and select Add and Remove, then add the project.
install and run the client-side tools
-
install Node.js and npm: see https://nodejs.org/en/download/
-
Install webpack:
c:\> npm install -g webpack -
Populate JavaScript module dependencies into
node_modulesrepository:c:\net-monitor> npm install -D -
Use webpack and Babel to transpile, add polyfill, minify and package the JavaScript module.
c:\net-monitor> webpack --verboseThis will create
src/main/javascript/public/net-monitor/net-monitor-*.jsfromsrc/main/javascript/src/net-monitor.jsand relative dependencies innode_modules -
Finally, run webpack in listen mode:
c:\net-monitor> webpack -w
start the server
You can now start the server and visit the demo on http://localhost:8080/net-monitor
Notes:
- if you apply changes to the Java sources or resources, Eclipse will automatically reload the servlet.
- If you apply changes to the
webpack.config.jsconfiguration file, you should restart webpack and restart the server. - If you apply changes to the JavaScript sources in
src\main\javascript\src, you need to wait for webpack to apply changes into thesrc\main\javascript\publicdirectory. Then refresh the project in the Project Explorer window (select the project and type F5), for Eclipse to publish the new bundle and standalone builds.
debugging JavaScript client library
Two debugging builds are available from the npmjs repository, the Cloudflare CDN and the JEE server: just replace min with dev in the path to the JavaScript resources.
Those builds are:
- not processed with Babel
- not minified
- not transpiled, so written with a subset of pure ECMAScript® 2015
- free of any Polyfill
For instance, on Cloudflare, you can access the debugging resources here:
-
standalone debugging build: https://eowyn.eu.org/cloudflare/net-monitor-latest.standalone.dev.js
-
bundle debugging build: https://eowyn.eu.org/cloudflare/net-monitor-latest.bundle.dev.js
Using the standalone debugging build is the easiest way to update and debug this software.
developing on the client side
To develop on the client side, using Eclipse may not be the best way to take into account JavaScript and html code updates immediately. Therefore, using tools specifically designed for JavaScript developers is a better idea.
set-up an initial environment
First, install npm.
List global npm packages installed:
npm ls -gRemove global packages installed:
npm remove bower -g
npm remove webpack -g
...
Clean up packages and dependencies:
rm -rf node_modules
rm package-lock.json
Update dependencies and devDependencies in package.json
Update npm:
% npm -v
5.6.0
% npm install npm@latest -g
C:\Users\fenyo\AppData\Roaming\npm\npx -> C:\Users\fenyo\AppData\Roaming\npm\node_modules\npm\bin\npx-cli.js
C:\Users\fenyo\AppData\Roaming\npm\npm -> C:\Users\fenyo\AppData\Roaming\npm\node_modules\npm\bin\npm-cli.js
+ npm@5.7.1
added 533 packages in 39.69s
Check for npm dependencies just installed:
 % npm ls -g
C:\Users\fenyo\AppData\Roaming\npm
`-- npm@5.7.1
  +-- abbrev@1.1.1
  +-- ansi-regex@3.0.0
  +-- ansicolors@0.3.2
  +-- ansistyles@0.1.3
  +-- aproba@1.2.0
...
Install dependencies in net-monitor:
 % npm install -D
...
% ls node_modules
chart.js/  chartjs-color/  chartjs-color-string/  color-convert/  color-name/  jquery/  moment/  webstomp-client/
Add the following dev dependencies in package.json: babel-cli, babel-core, babel-loader, babel-polyfill, babel-preset-env, webpack, webpack-cli, webpack-dev-server.
common operations
Run webpack:
% npx webpackRun a development server:
npm run devor
npx webpack-dev-server --config webpack.dev.js --port 8082The development server runs on port 8082, therefore you can launch the net-monitor server with Eclipse on port 8080. This way, the net-monitor server answers to http requests sent to http://localhost:8080/net-monitor and to web socket connections sent to http://localhost:8080/net-monitor/dispatch/socket.
Connect your browser to the development server: http://localhost:8082/src/main/webapp/index-dev.html
Support
Best-effort support is available here :

written with StackEdit - Support StackEdit

StackEdit is a full-featured, open-source Markdown editor based on PageDown, the Markdown library used by Stack Overflow and the other Stack Exchange sites.