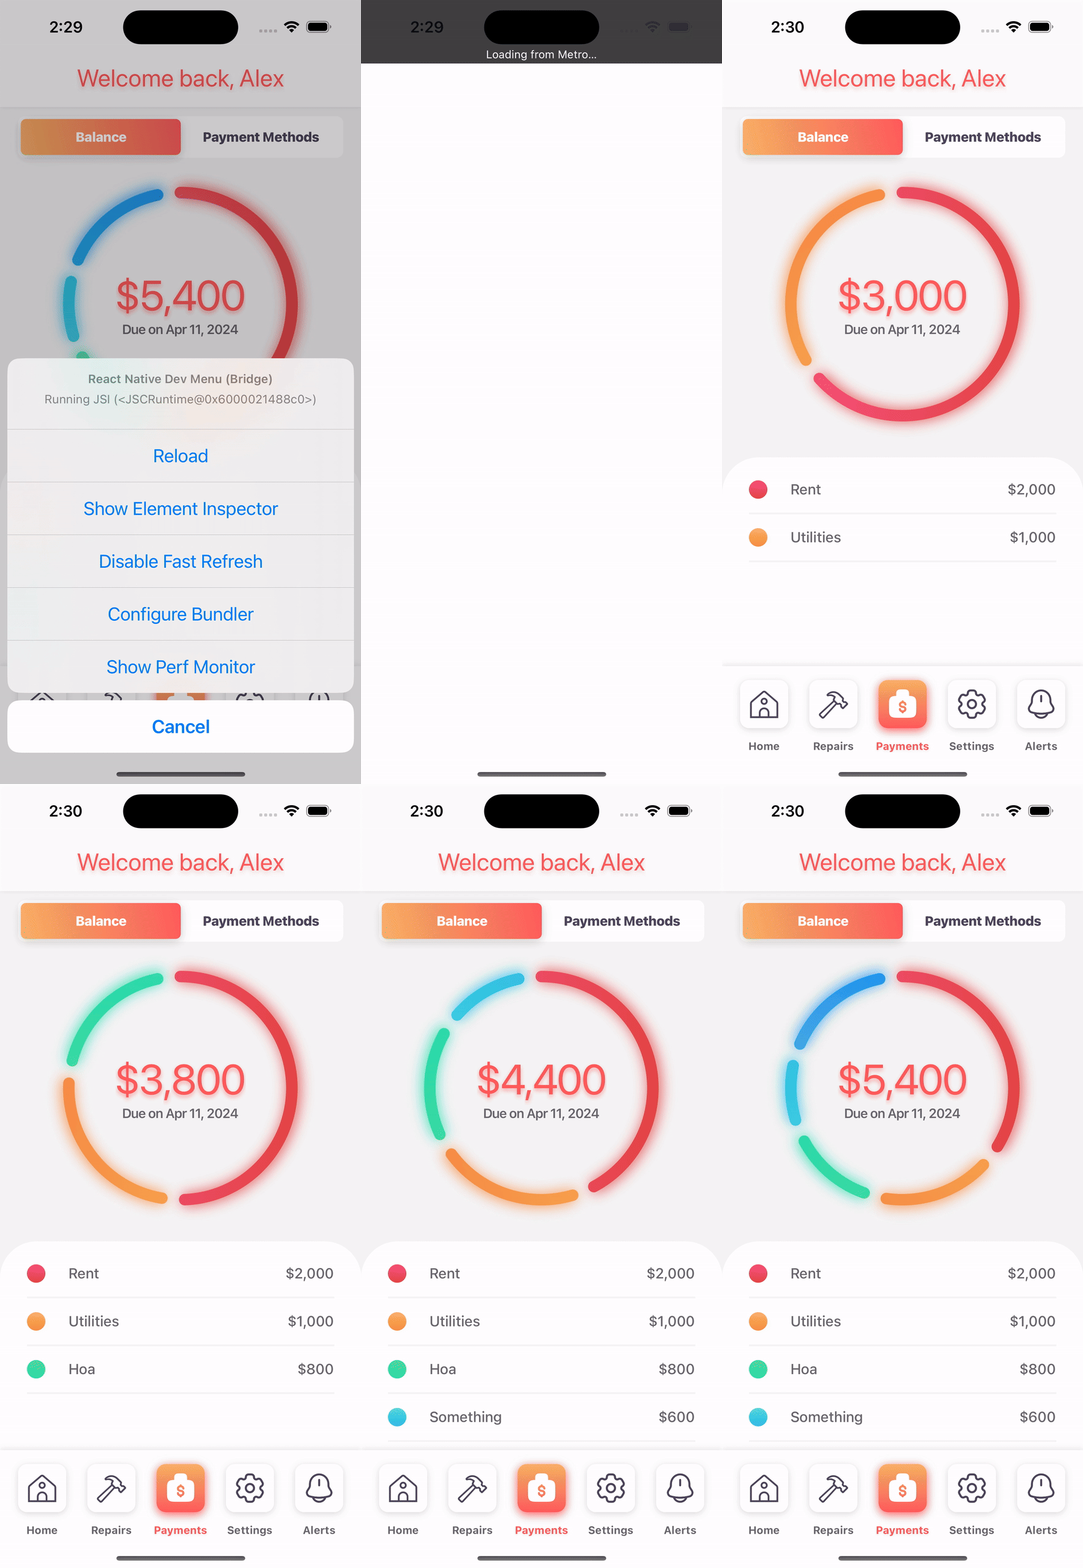
A React Native library for creating responsive donut charts that animate when data changes
npm i -S @figliolia/rn-donut-chart react-native-svg
# or
yarn add @figliolia/rn-donut-chart react-native-svg
If you did not already have react-native-svg installed, go ahead and link the native libraries:
cd ios && pod install<DonutChart
delay={0}
duration={1500}
strokeWidth={12}
strokeLinecap="round"
style={Styles.yourContrainerStyles}
data={[{
label: "rent",
value: 2000,
stroke: "rgb(228, 69, 69)",
style: Styles.yourSVGStyles // such as shadow and stuff
}]}
easing={Easing.out(Easing.exp)}
onMeasure={(dimensions: number) => {}}>
{children}
</DonutChart>delay?: A millisecond duration to delay the animation. Defaults to 0
duration?: A milliscond duration for the animation. Defaults to 1500
easing?: An easing function for your animation. Defaults to cubic-bezier(0.16, 1, 0.3, 1) or React Native's Easing.out(Easing.exp)
data: Data to supply the chart's sections
strokeWidth?: The width of the donut arcs. Defaults to 25
strokeLinecap?: A line cap style - round, square, or butt. Defaults to round
style?: Styles for the View containing your graph
onMeasure?: A callback invoked with the resolved dimensions of your graph, useful if using responsive sizes
children?: React Node's for adding UI elements to your graph

