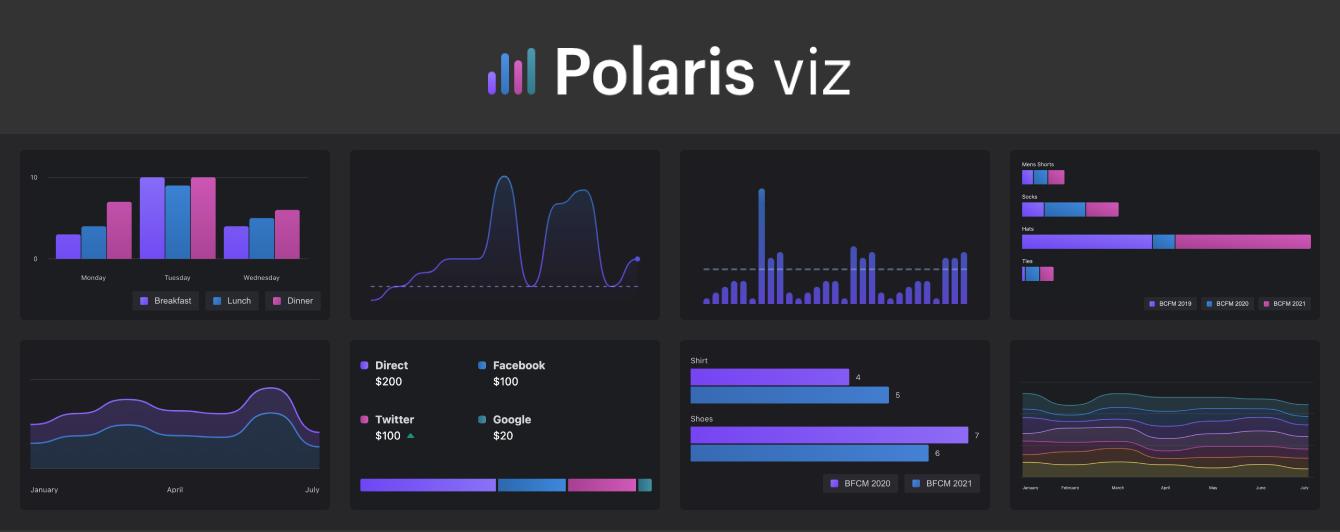
Polaris Viz is Shopify's data visualization system. It's what powers many of our data heavy experiences, including ShopifyQL Notebooks.
It is composed of two consumer-facing libraries:
a collection of React components built for web
Both libraries use the same Data Structure, Utility functions, Themes and SubComponents. All things shared between @shopify/polaris-viz and @shopify/polaris-viz-native are documented in the Storybook's Shared folder
Our libraries are structured to favor charts that prioritize accessibility and motion design. The goal is to help users create clear and meaningful analytics experiences.
We want to do the heavy lifting of developing charts, so our partners can focus on telling amazing data stories and not re-inventing the wheel.
🤝 Contributing
Want to help us build the future of data viz? The system is currently in active development and we are working on expanding its features and available charts.
Pull requests are welcome! See the contribution docs for more information and to learn how to set up your development environment.
📃 Licenses
Source code is under a custom license based on MIT. The license restricts Polaris Viz usage to applications that integrate or interoperate with Shopify software or services, with additional restrictions for external, stand-alone applications.


