| Module | Info |
|---|---|
| ag-charts-community |
 |
| ag-charts-enterprise |
 |
| ag-charts-vue |
 
|
AG Charts Vue
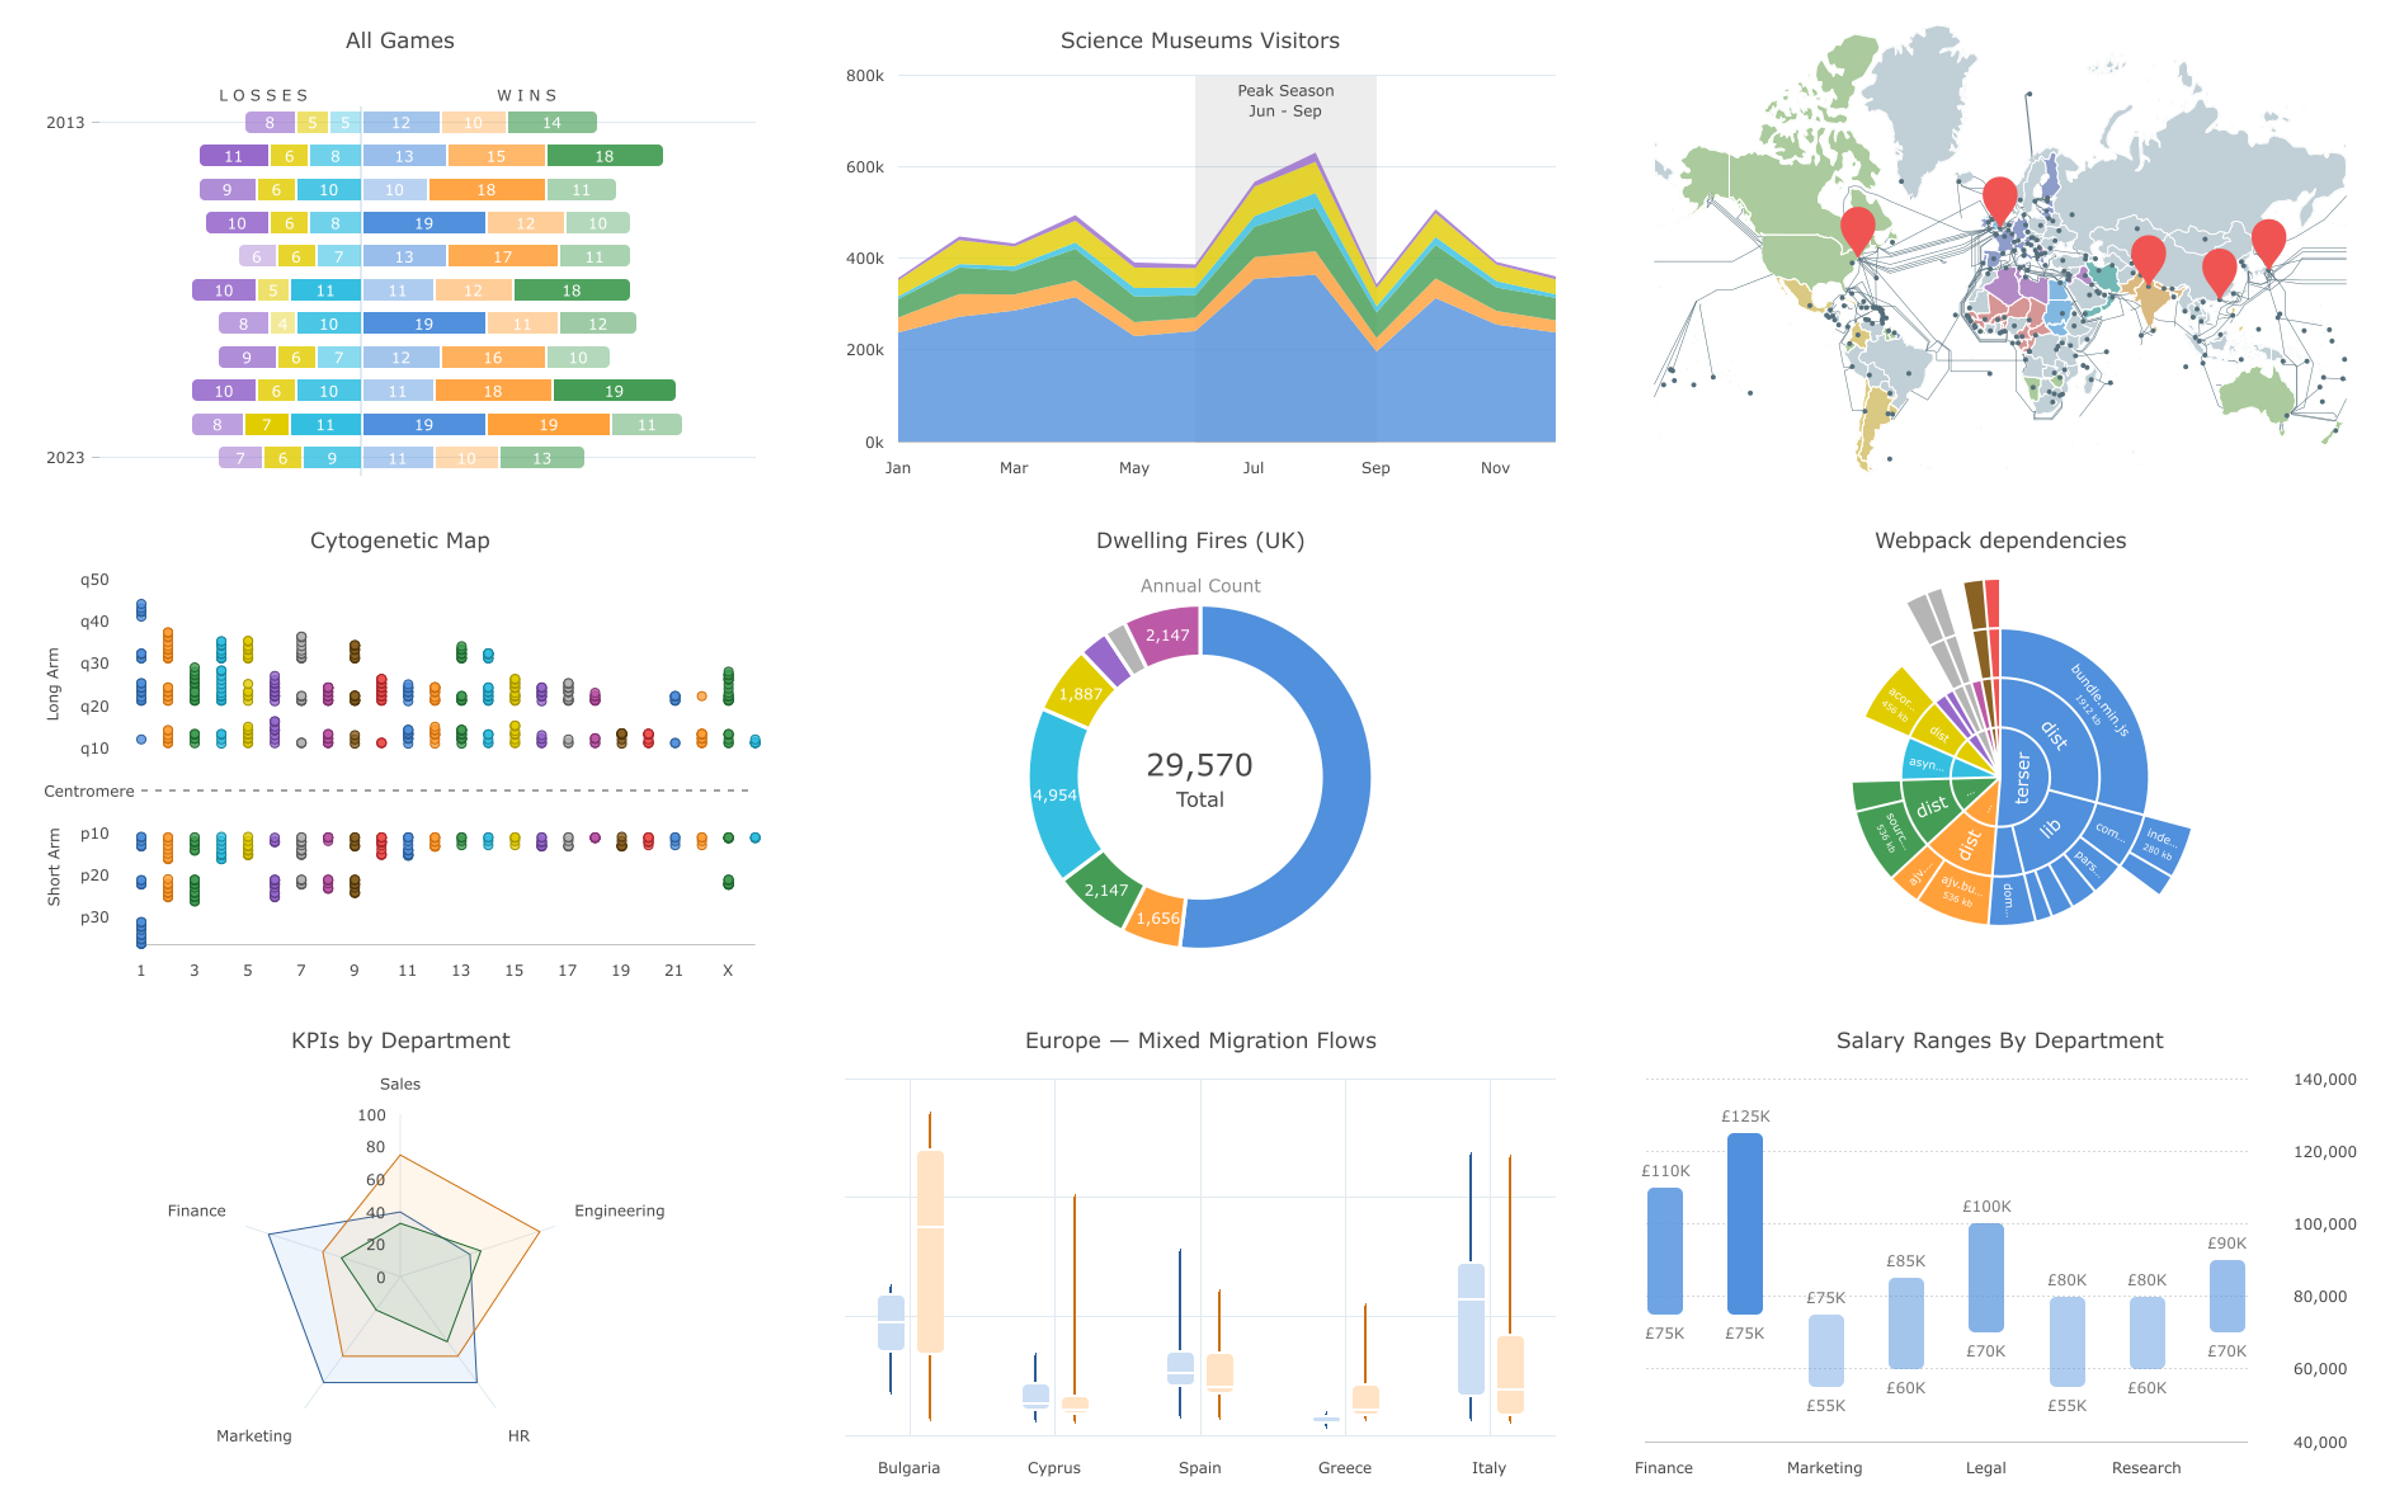
AG Charts is a fully-featured and highly customizable JavaScript charting library. The professional choice for developers building enterprise applications.
It delivers outstanding performance, has no third-party dependencies and integrates smoothly with all major JavaScript frameworks.
Here are some of the features that make AG Charts stand out:
- Modern, lightweight and performant.
- Framework agnostic:
- thin reactive wrappers for your chosen framework: React, Angular, Vue;
- or use our plain Javascript API with 1st-class Typescript support.
- Zero dependencies.
- Simple & clean declarative configuration.
- Comprehensive interactive documentation.
| Supported Chart Types | Advanced Features | ||
|---|---|---|---|
|
Line, Bar & Area Scatter & Bubble Pie & Donut Histogram* Map* Candlestick & OHLC* Box Plot* |
Heatmap* Nightingale* Range Bar* & Range Area* Radar Area* & Radar Line* Radial Bar* & Radial Column* Sunburst* & Treemap* Bullet* |
Animation* Synchronized Charts* Context Menu* Crosshairs* Cross Lines Error Bars* |
Theming Zoom* |
* These are available in the Enterprise version only.
Check out the developer documentation for a complete list of features or visit our official docs for tutorials and feature demos.
Get started with Vue.
Installation for Vue.
If you have found a bug, please report it in this repository's issues section. If you're using the Enterprise version, please use the private ticketing system to do that.
Look for similar problems on StackOverflow using the ag-charts tag. If nothing seems related, post a new message there. Please do not use GitHub issues to ask questions. If you're using the Enterprise version, please use the private ticketing system to do that.
AG Charts is developed by a team of co-located developers in London. If you want to join the team send your application to info@ag-grid.com.
This project is licensed under the MIT license. See the LICENSE file for more info.


