Angular Digest HUD
Digest performance analysis HUD for AngularJS.
angular;The Digest HUD will have a performance impact on your code and there's no way to disable it once enabled, so as a rule you probably don't want to turn it on in production. When it's enabled you'll see a small digest summary fixed in the lower-right corner of the window:
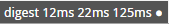
The numbers show the minimum, median, and maximum running time of the last 25 (or numDigestStats) digests. At the end of the line a dot blinks on or off every time a digest runs. Together this gives you a quick idea of how hard your app's digest cycle is working.
You can click on the summary to show a snapshot of more detailed stats (this example is taken from Reviewable):
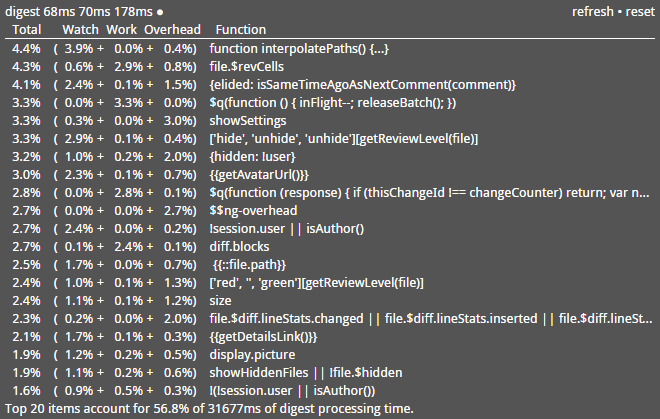
This shows the top 20 (or numTopWatches) items that are slowing down your digest. Each item leads with the percentage of total digest processing time that was spent on it, which is then broken down into three parts: "watch" time spent evaluating the watch expression, "work" time spent running the listener, and "overhead" time spent in Angular's core code not captured by the other two (e.g., comparing or copying values). Not everything that executes during a digest is a watcher, though. You also get $evalAsync and $applyAsync functions, and $q promise callbacks, where some of the timing parts are not applicable and will always be zero. There's also the special placeholder $ng-overhead which stands in for time spent in the digest loop that we can't attribute to any of your code—for example, time spent traversing the scope hierarchy.
You can hover over any line to get a popup with the full, properly-formatted function if it doesn't fit in the table. You can also copy the table onto the clipboard by hitting command-c (or ctrl-c) when the table has focus, for example right after expanding it.
At the bottom of the table there's a line that summarizes total digest processing time sampled so far, and the percentage of it represented in the table. In the top-right corner, there are two controls that allow you to refresh the table from the latest data (this happens automatically whenever you expand the widget) or to reset the data gathered so far and start sampling from scratch.
One thing to note is that in some rare cases one item may be part of another's execution. When this happens, the running time of the nested item is not counted in its parent.