ember-cli-bundle-analyzer
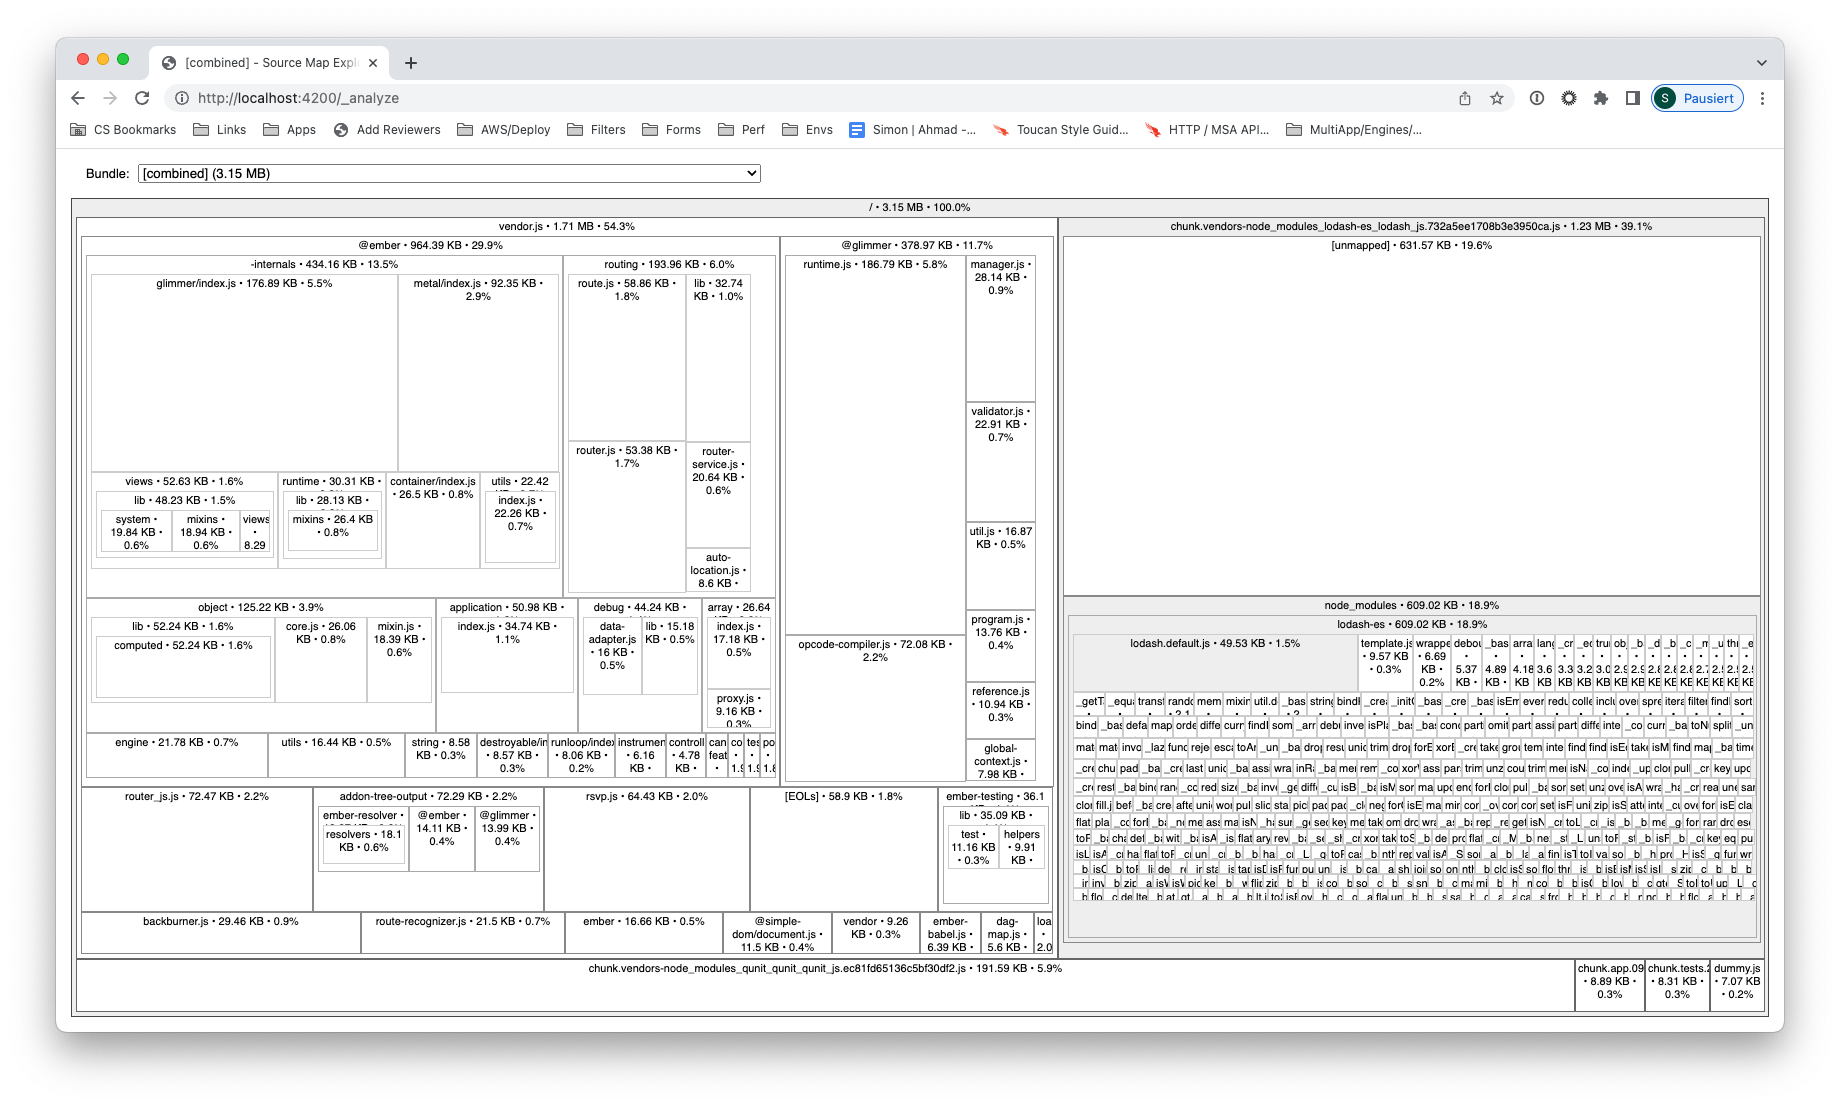
An Ember CLI addon to analyze the size and contents of your app's bundled output, using an interactive zoomable treemap.
View the interactive Demo
This helps you to
- analyze which individual modules make it into your final bundle
- find out how big each contained module is
- find modules that got there by mistake
- optimize your bundle size
It uses source-map-explorer under the hood, and wraps it in an Ember CLI addon to make it easy to use.
Given that it works based on source maps, it is agnostic to the actual bundling tool used, be it pure Ember CLI (which is based on broccoli-concat), Ember CLI with ember-auto-import (which makes it a mix of broccoli-concat and webpack) or even Embroider.
The only condition is that proper source maps are generated.
Compatibility
- Ember CLI v3.28 or above
- Node.js v16 or above
- works with ember-auto-import and Embroider, as long as source maps are properly enabled
Quick Start
To get you going quickly, follow these steps:
-
Install the addon:
ember install ember-cli-bundle-analyzer -
Setup your
ember-cli-build.js:const EmberApp = require('ember-cli/lib/broccoli/ember-app'); +const { + createEmberCLIConfig, +} = require('ember-cli-bundle-analyzer/create-config'); module.exports = function (defaults) { const app = new EmberApp(defaults, { // your other options are here // ... + ...createEmberCLIConfig(), }); return app.toTree(); }; -
Launch your local server in analyze-mode:
ENABLE_BUNDLE_ANALYZER=true ember serve --prod
For more detailed instructions, read the following chapters...
Setup
Two things need to be in place for this addon to work correctly: it needs to have a config that at least enables it, and proper source maps need to be enabled for the EmberCLI build pipeline.
While it is possible to provide these settings manually, the addon provides some recommended presets that you can apply using createEmberCLIConfig:
// ember-cli-build.js
const EmberApp = require('ember-cli/lib/broccoli/ember-app');
const {
  createEmberCLIConfig,
} = require('ember-cli-bundle-analyzer/create-config');

module.exports = function (defaults) {
  const app = new EmberApp(defaults, {
    // your other options are here
    // ...
    ...createEmberCLIConfig(),
  });

  return app.toTree();
};
If you are using Embroider, then this should cover you:
// ember-cli-build.js
const EmberApp = require('ember-cli/lib/broccoli/ember-app');
const {
  createEmberCLIConfig,
  createWebpackConfig,
} = require('ember-cli-bundle-analyzer/create-config');

module.exports = function (defaults) {
  const app = new EmberApp(defaults, {
    // your other options are here
    // ...
    ...createEmberCLIConfig(),
  });

  return require('@embroider/compat').compatBuild(app, Webpack, {
    // your Embroider options...
    packagerOptions: {
      webpackConfig: {
        // any custom webpack options you might have
        ...createWebpackConfig(),
      },
    },
  });
};
With this config, when the environment variable ENABLE_BUNDLE_ANALYZER is set, it will enable the addon and apply required options to both Ember CLI and ember-auto-import to fully enable source maps with the required fidelity level.
The reason the addon is not enabled by default is that it would be pointless if not having proper source maps fully enabled as well. And this might not be what you want by default, as generating full source maps comes at a cost of increased build times. On top of that you might also want to analyze the bundles only in production mode.
Note that this might override some of your existing custom settings for source maps or ember-auto-import if you have those. So if that does not work for you, you can either try to deep merge the configs as in the following example, or provide your own explicit configs based of what createEmberCLIConfig provides.
// ember-cli-build.js
const EmberApp = require('ember-cli/lib/broccoli/ember-app');
const {
  createEmberCLIConfig,
} = require('ember-cli-bundle-analyzer/create-config');
const { defaultsDeep } = require('ember-cli-lodash-subset');

module.exports = function (defaults) {
  const app = new EmberApp(
    defaults,
    defaultsDeep(
      {
        // your other options are here
        // ...
      },
      createEmberCLIConfig()
    )
  );

  return app.toTree();
};
Config
You can customize the precessing by setting any of the following configs into the 'bundleAnalyzer' key of your
ember-cli-build.js:
-
enabled(boolean): set totrueto enable the addon.falseby default. -
ignoreTestFiles(boolean): by default it will exclude all test files from the output. Set this tofalseto include them. -
ignore(string | string[]): add files to ignore. Glob patterns are supported, e.g.*-fastboot.js.
Source maps
The bundle size output that you see coming from this addon can only be as good as the underlying source maps are. For source-map-explorer to correctly process those, they should have the full source code included inline (which is the sourcesContent field in a .map file).
For the broccoli-concat based part of Ember CLI (processing the app itself as well as all v1 addons), enabling source maps using sourcemaps: { enabled: true }, in ember-cli-config.js will be enough.
For any webpack based build (be it ember-auto-import or Embroider), the default settings will not be enough. The only setting that works reliably is enabling high-fidelity source maps using devtool: 'source-map'.
Again, for enabling source maps with the recommended options, using the createEmberCLIConfig() helper as mentioned above is recommended.
For further information consider these resources:
- Enabling source maps in Ember CLI
- Adding custom webpack config to ember-auto-import
- Adding custom webpack config to Embroider
- webpack's devtool
Usage
You need to have the addon and source maps enabled as described under Setup. When following the recommended approach of using createEmberCLIConfig to apply the addon provided presets, then opting into the bundle-analyzer enabled mode is done by enabling the ENABLE_BUNDLE_ANALYZER environment flag when starting your local dev server. Most likely you will also want to analyze the production mode build, to exclude any debugging code. So the final invocation would be:
ENABLE_BUNDLE_ANALYZER=true ember serve --prodAfter startup this addon adds a custom middleware listening to the /_analyze URL path. So just open http://localhost:4200/_analyze in your web browser to access the analyzer output.
While it processes the data a loading screen might appear, after which the final output should display.
Live reloading is supported, so whenever you change a project file the output will be re-computed and updated automatically.
Contributing
See the Contributing guide for details.
License
This project is licensed under the MIT License.
