gobble-grapher
Displays an interactive graph of your GobbleJS workflow
What
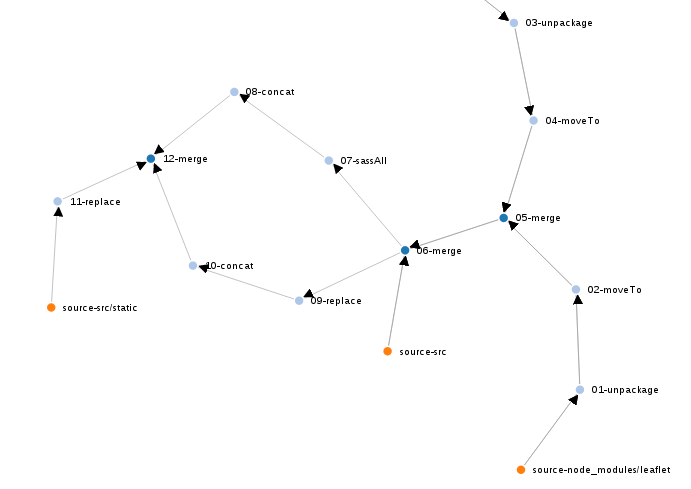
Gobble-grapher is a small tool to help developers understand what is going on in GobbleJS workflows, specially in complex ones.
Gobble-grapher starts a trivial node.js webserver, which will serve a D3-powered interactive directed graph, much like the following image:
Install
As usual, run npm install --save gobble-grapher or npm install --save-dev gobble-grapher before trying to use it.
Note that gobble-grapher is not a gobble plugin, and you won't be interactively prompted about installing it.
How to use
If the end of your gobblefile looks like this:
module.exports = gobble([js, css, whatever]);Just wrap the last gobble node into a gobble-graph call, like this:
var gobbleGrapher = require('gobble-graph');
module.exports = gobbleGrapher( gobble([js, css, whatever]) );
Then run gobble as usual, or js gobblefile.js if you don't need the build and just want to see the graph. After that, point your favourite web browser to http://localhost:4568.
The graph is interactive: drag the nodes to move them around.
The ideal way to use gobble-grapher is to graph the last node in the workflow. Wrapping other nodes may lead to unexpected results.
Caveats
Gobble-grapher is very young and does the bare minimum. Right now it does not:
- Work well when the gobblefile changes
- Display info about the transformer/merger nodes (options, etc)
- Display the files in a given node
- Reload the files in nodes whenever they change
It also requires an active connection to the internet to pull the D3 library from a CDN.
Legalese
"THE BEER-WARE LICENSE": ivan@sanchezortega.es wrote this file. As long as you retain this notice you can do whatever you want with this stuff. If we meet some day, and you think this stuff is worth it, you can buy me a beer in return.
