
Leaflet.minichart
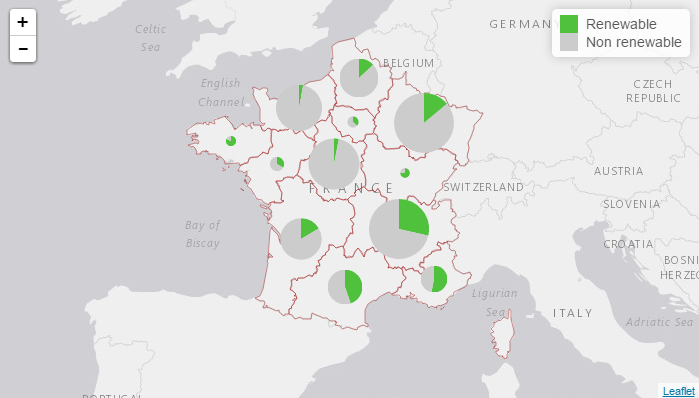
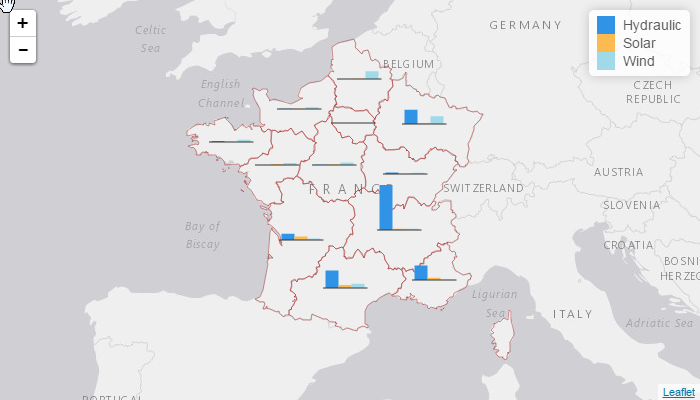
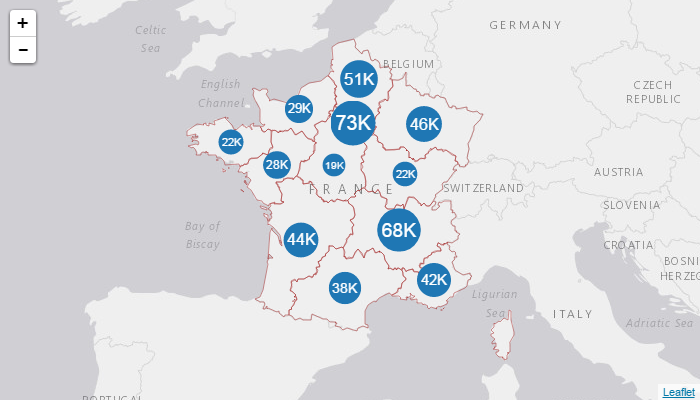
Leaflet.minichart is a leaflet plugin for adding to a leaflet map small animated bar charts, pie charts or polar area charts.
It can be used to visualize multiple variables associated to geographical coordinates and to look at the evolution of these variables.
Here are screenshots of some maps that use this plugin.
This plugin is also available as an R package.
Usage
You need to include the leaflet CSS and javascript files and then the leaflet.minichart javascript file in the head section of your document:
Once these files included, you can create charts with function L.minichart(). All parameters are described here.
Example
Here is a sample code that initializes a map and adds to it a barchart that represents three random values. Then the code updates the value every two seconds and redraws the chart.
var center = 48861415 2349326;var mymap = L;L;// Let us generate fake data{return Math Math Math;}// Create a barchartvar myBarChart = L;mymap;// Update data every 2 seconds;
You can find more complete examples here: