middy-profiler
Middy middleware for profiling CPU on AWS Lambda. Captured CPU profiling data is put into specified AWS S3 bucket with the following object/file name format:
${functionName}/${awsRequestId}/${fileName}.cpuprofile
By default, file name (${fileName}) is cpu_profile but you can configure it as explained below.
Then, you can download the CPU profiling file from AWS S3 and open with any CPU profiler tool like Chrome DevTools:
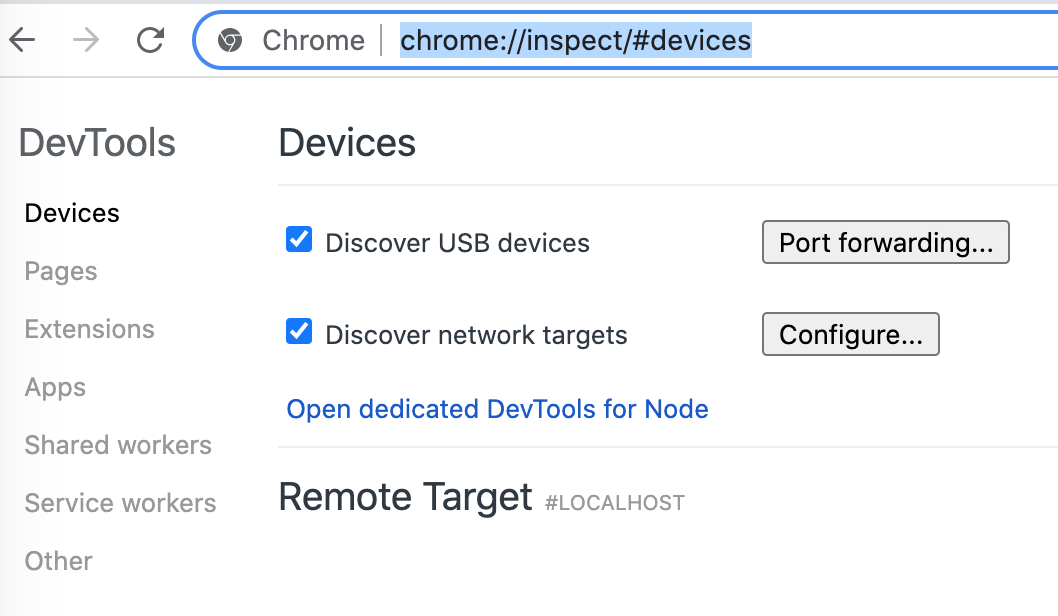
- Go to Inspector in Chrome DevTools by browsing to
chrome://inspect/:
- Click
Open dedicated DevTools for Nodeto go to theNode.js DevToolspage:
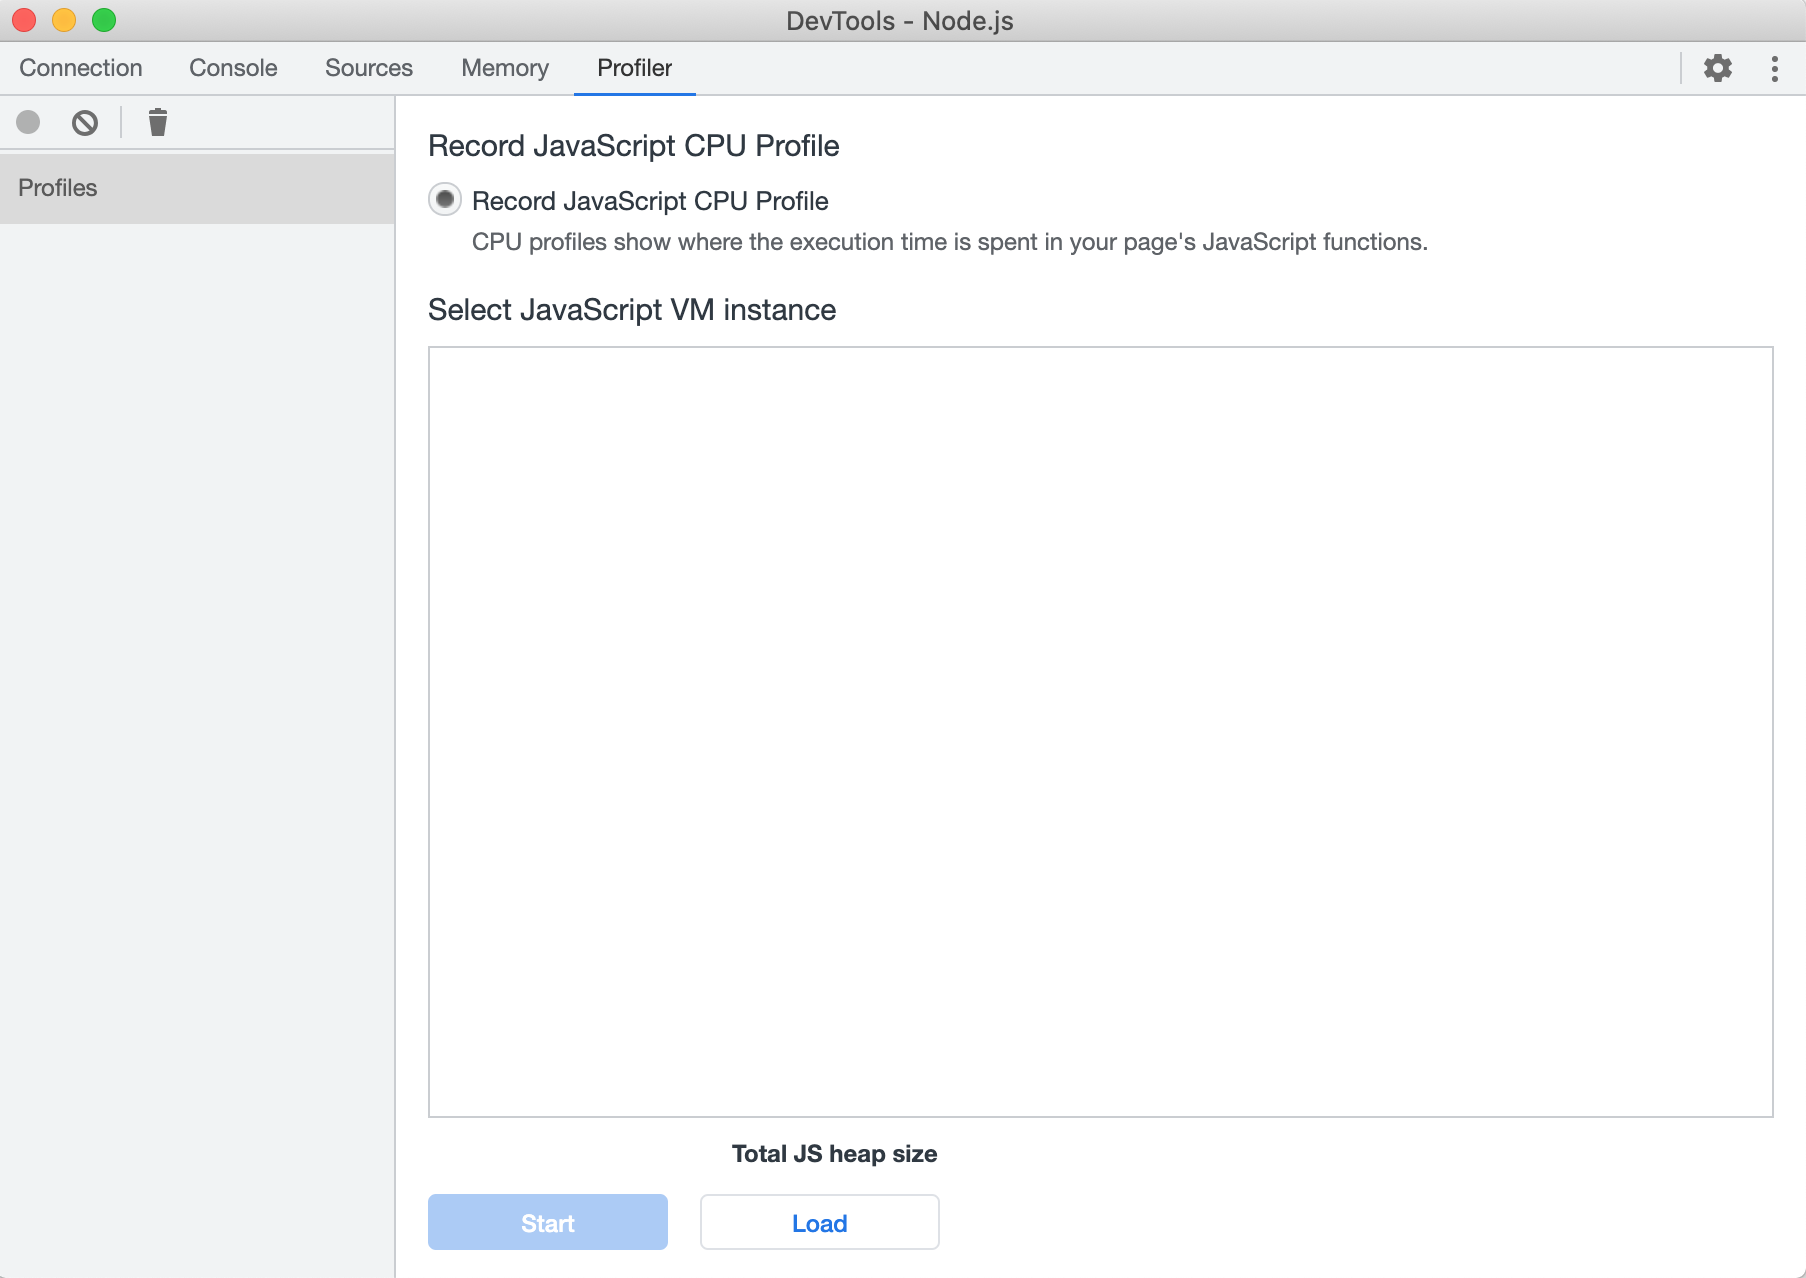
- Go to
Profilertab, click theLoadbutton and select the downloaded CPU profiling file to load:
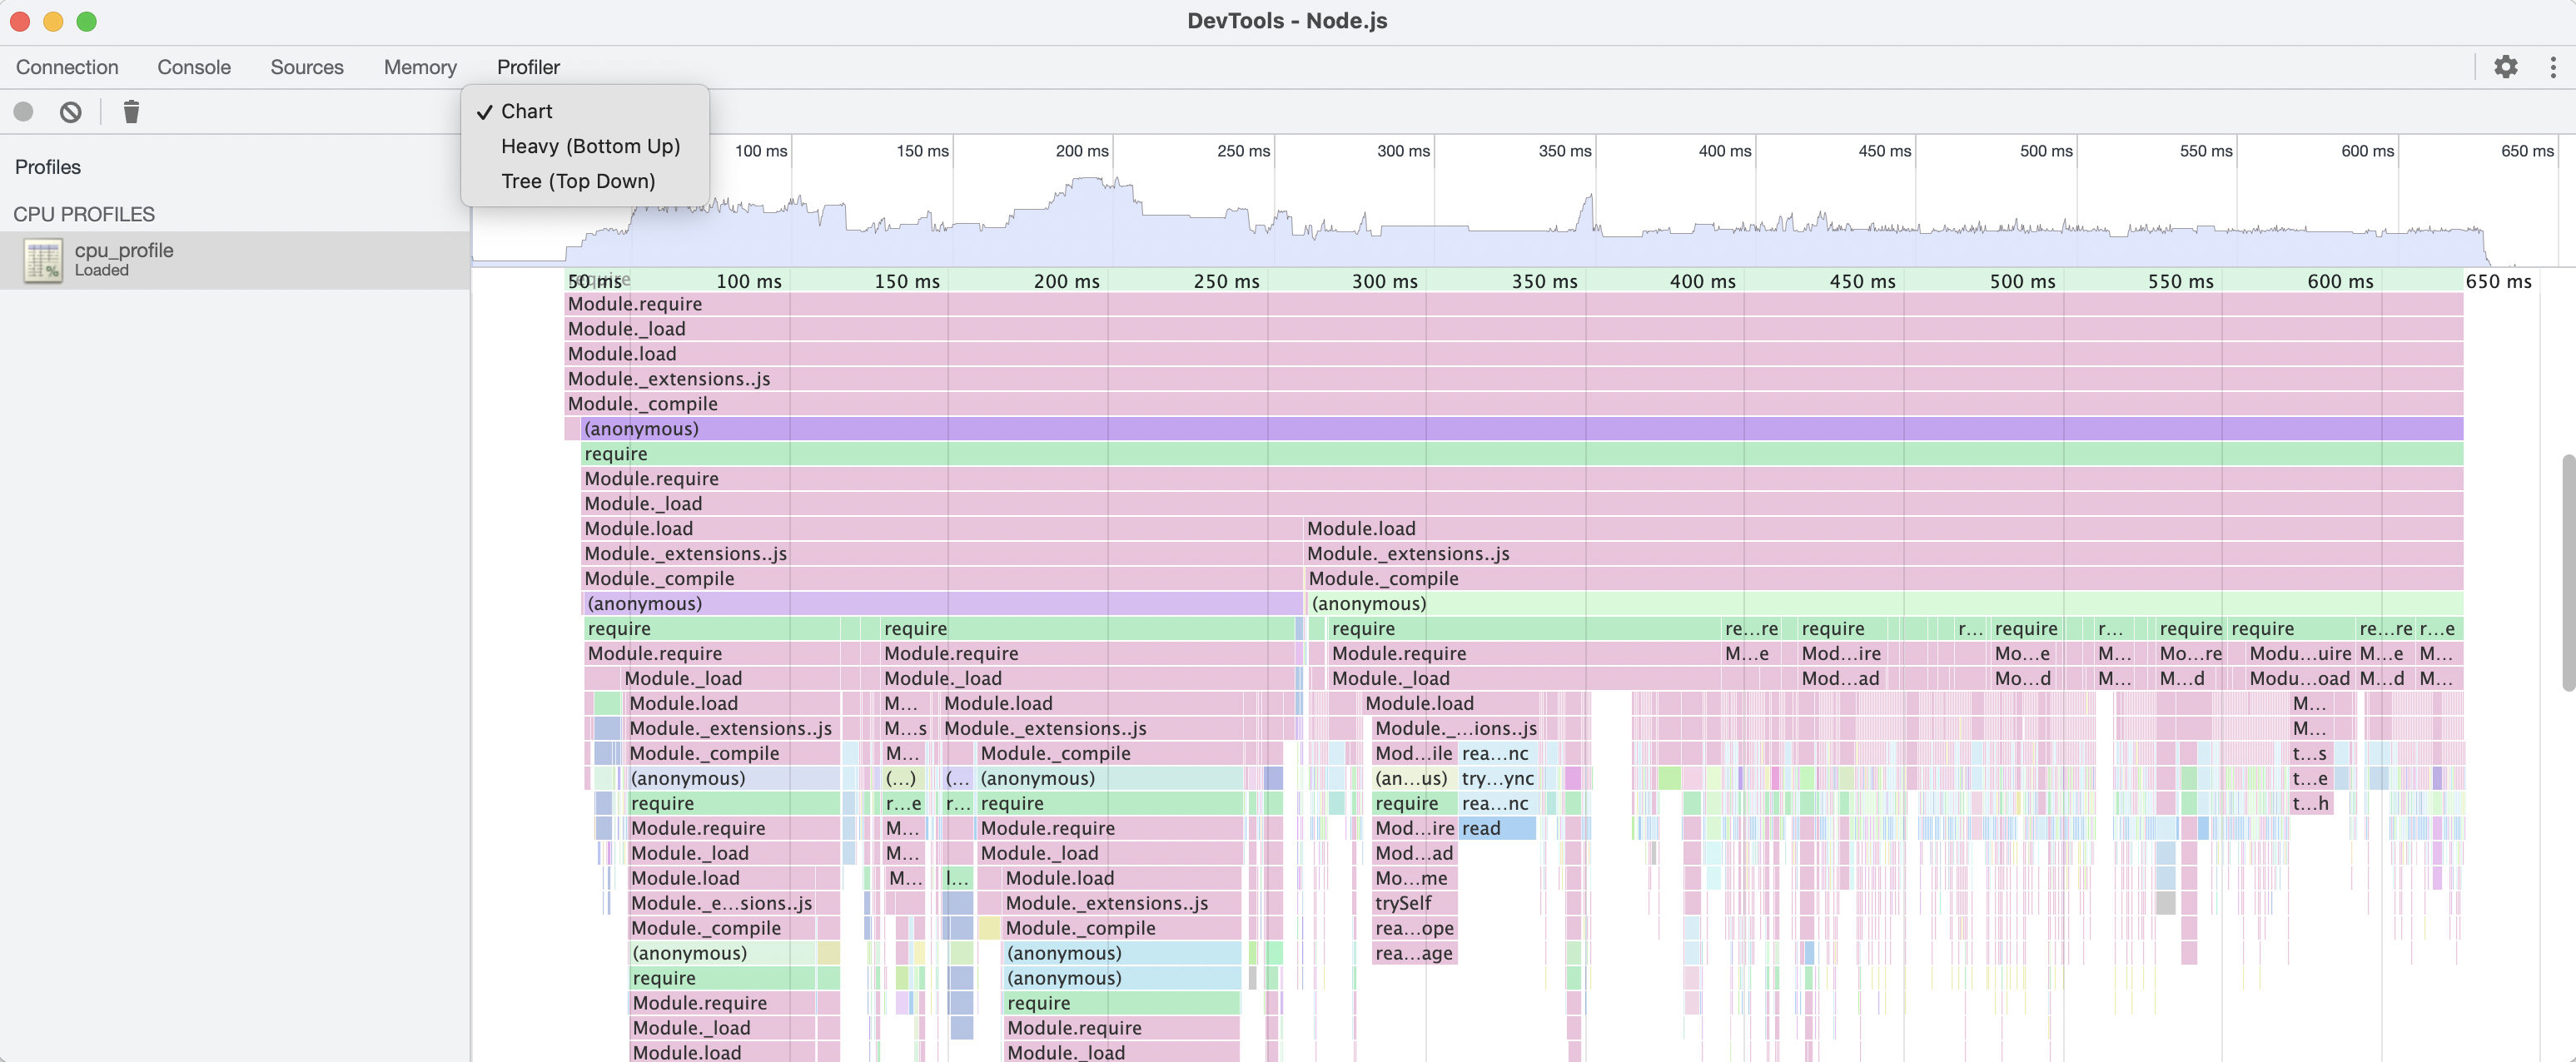
- Then select the
Chartto see the CPU profiling as flame graph:
Installation
You can add middy-profiler package into your AWS Lambda function either by NPM package or by AWS Lambda layer as shown below:
By NPM package
To install the middleware, you can use NPM:
npm install --save middy-profiler
By AWS Lambda Layer
You can also add middy-profiler as layer into your AWS Lambda function.
arn:aws:lambda:${region}:273094347961:layer:middy-profiler:${layer-version}
Latest layer version: (badge powered by Globadge serverless)
Note: In the ARN above, you need to replace ${region} with the actual AWS region you deployed your AWS Lambda function.
Notes on installation
-
The
middy-profilerrequires@middy/coreversion2.0.0+. -
There is also standalone mode to be able to use
middy-profilerwithoutmiddyframework. You can check Standalone Usage (without Middy) section for the details.
Usage
- Register
middy-profilermiddleware in your handler:
const middy = require('@middy/core');
const profiler = require('middy-profiler');

const handler = async(event, context) => {
  // Do something meaningful

  return {
    statusCode: 200,
  }
}

module.exports.handler = middy(handler).use(profiler());-
Configure AWS S3 bucket name to put the CPU profiling data by environment variable or options passed to middleware.
Note 1: Your AWS Lambda function must have enough permission (
PutObject) for writing to the specified target AWS S3 bucket.Note 2: This configuration is mandatory and if it is not specified, profiling will be disabled.
-
By environment variable:
Set
MIDDY_PROFILER_S3_BUCKET_NAMEenvironment variable with the target bucket name.
MIDDY_PROFILER_S3_BUCKET_NAME=my-profiling-bucket- By options: Pass the bucket name through options.
const profiler = require('middy-profiler');

module.exports.handler =
    middy(handler).
        use(profiler({
            s3: {
                bucketName: 'my-profiling-bucket'
            }
        })
    );
-
By environment variable:
Set
-
Optionally, if you want to profile since the init phase at coldstart (by default profiler is activated by the start of request which doesn't include initialization phase such as main handler import/require, client/SDK creation, etc ...), you need to activate profiler during bootstrap:
-
By environment variable:
Set (or append to existing one)
NODE_OPTIONSenvironment variable with the bootstrap options to initialize profiler at startup.
NODE_OPTIONS=-r middy-profiler/src/bootstrap -
By environment variable:
Set (or append to existing one)
-
Optionally, you can configure CPU sampling interval in milliseconds. Please note that a high (for ex.
100,500,1000) sampling interval may result in an extremely high level of profiling output (not enough detail) being captured. By default, sampling interval is10milliseconds and it can be configured by environment variable or options passed to middleware:-
By environment variable:
Set
MIDDY_PROFILER_SAMPLING_INTERVALenvironment variable with the desired sampling interval.
MIDDY_PROFILER_SAMPLING_INTERVAL=50- By options: Pass the sampling interval through options.
const profiler = require('middy-profiler');

module.exports.handler =
    middy(handler).
        use(profiler({
            samplingInterval: 50
        })
    );
-
By environment variable:
Set
-
Optionally, you can configure name of the profiling data file which is put into target AWS S3 bucket. It's value is
cpu_profileby default but can be configured by environment variable or options passed to middleware:-
By environment variable:
Set
MIDDY_PROFILER_S3_FILE_NAMEenvironment variable with the name of the file.
MIDDY_PROFILER_S3_FILE_NAME=lambda_invocation_cpu_profile- By options: Pass the file name through options.
const profiler = require('middy-profiler');

module.exports.handler =
    middy(handler).
        use(profiler({
            s3: {
                fileName: 'lambda_invocation_cpu_profile'
            }
        })
    );
-
By environment variable:
Set
-
Optionally, you can configure timeout margin (in milliseconds) which is the minimum remaining time before the actual timeout happens to assume that invocation will timeout. So we take action, finish the profiler and report the collected profiling data because when the timeout happens, the game is over and there is nothing to do. By default, timeout margin is
1000milliseconds and it can be configured by environment variable or options passed to middleware:-
By environment variable:
Set
MIDDY_PROFILER_TIMEOUT_MARGINenvironment variable with the desired value for the timeout margin.
MIDDY_PROFILER_TIMEOUT_MARGIN=500- By options: Pass the timeout margin through options.
const profiler = require('middy-profiler');

module.exports.handler =
    middy(handler).
        use(profiler({
            timeoutMargin: 500
        })
    );
-
By environment variable:
Set
-
Optionally, you can configure start delay (in milliseconds) to start the profiler after specified amount of time (for ex. conditionally start profiler if invocation took longer than expected). It can be configured by environment variable or options passed to middleware:
-
By environment variable:
Set
MIDDY_PROFILER_START_DELAYenvironment variable with the desired value for the profiler start delay.
MIDDY_PROFILER_START_DELAY=5000- By options: Pass the start delay through options.
const profiler = require('middy-profiler');

module.exports.handler =
    middy(handler).
        use(profiler({
            startDelay: 5000
        })
    );
-
By environment variable:
Set
-
Optionally, you can configure invocation duration threshold (in milliseconds) to be able to report profiling data conditionally if the invocation duration is higher than the specified threshold. It can be configured by environment variable or options passed to middleware:
-
By environment variable:
Set
MIDDY_PROFILER_REPORT_DURATION_THRESHOLDenvironment variable with the desired value for the invocation duration threshold to report profiling data conditionally.
MIDDY_PROFILER_REPORT_DURATION_THRESHOLD=10000- By options: Pass the report duration threshold through options.
const profiler = require('middy-profiler');

module.exports.handler =
    middy(handler).
        use(profiler({
            report: {
                durationThreshold: 10000
            }
        })
    );
-
By environment variable:
Set
-
Optionally, you can disable/enable profiler without changing code even though it is registered to
middyor self activated on bootstrap.-
By environment variable:
Set
MIDDY_PROFILER_ENABLEenvironment variable tofalseto disable profiler or totrue(which is default) to enable profiler back.
MIDDY_PROFILER_ENABLE=false -
By environment variable:
Set
Standalone Usage (without Middy)
If you want to use middy-profiler standalone without middy, you need to activate standalone mode during bootstrap through environment variable without any code change. For activation, you need to set (or append to existing one) NODE_OPTIONS environment variable with the standalone mode bootstrap options to initialize profiler at startup:
NODE_OPTIONS=-r middy-profiler/src/standalone
To configure profiler in the standalone mode, you can use environment variables mentioned in the Usage section above.
Use Cases
- Vincent Voyer discovered significant performance impact of enabling source maps with the help of this profiler. You can find more info here: https://twitter.com/vvoyer/status/1498436054851981320
Contributing
Everyone is very welcome to contribute to this repository. Feel free to raise issues or to submit Pull Requests.
License
Licensed under MIT License.


