penplot
An experimental and highly opinionated development environment for generative and pen plotter art.
Some features:
- Zero configuration: just run a command and start writing
<canvas>renderings - Fast live-reload on file save
- Hotkey for high-quality PNG output
- Hotkey for SVG rendering
- A builtin library of utilities for random numbers, geometry tools, SVG exporting, and other functions
- Easy integration with Inkscape and AxiDraw v3
Quick Start
You can install this with npm.
npm install penplot -gHere is a simple command you can use to quick-start a new plot:
penplot src/index.js --write --openThis will write a new src/index.js file and open localhost:9966. Now start editing your index.js file to see the LiveReload in action.

While in your browser session, you can hit Cmd/Ctrl + P to export the SVG to a file in your Downloads folder, or Cmd/Ctrl + S to save a PNG file.
The SVG should be formatted to fit a Letter size paper with a pen plotter like AxiDraw V3.
Penplot Modules
The penplot tool is both a development environment and kitchen sink of utility functions. It tries to make some aspects easier for you, like sizing and printing to SVG or PNG.
The --write flag generates a simple plot that looks like this:
// Some handy functions & constants;;; // Export the paper layout & dimensions for penplot to set upconst orientation = OrientationLANDSCAPE;const dimensions = PaperSizeLETTER; // The plot functiond defines how the artwork will look { const width height = dimensions; let lines = ; // Add [ x, y ] points to the array of lines // e.g. [ [ 5, 2 ], [ 2, 3 ] ] is one line ... algorithmic code ... // Clip all the lines to a 1.5 cm margin for our pen plotter const margin = 15; const box = margin margin width - margin height - margin ; lines = ; return draw print background: 'white' // used when exporting the canvas to PNG ; { lines; } { return ; }}All units here are in centimeters (including width and height), which makes it easy to reason about things like line thickness and distances.
Using an array of line primitives, you can build up complex prints that can be easily exported to SVG or PNG. However, this means everything will be built from line segments; e.g. circles are generated with cos() and sin().
See the Some Examples for more inspiration.
More Commands
Here are some commands you can try.
# stub out a new file called plot.js penplot plot.js --write # run plot.js and open the browser penplot plot.js --open # set the output folder for SVG/PNG files penplot plot.js --output=tmpPrint Output
You can also use this as a tool for developing algorithmic/generative art. For example, you can develop the artwork in a browser for LiveReload and fast iterations, and when you want to print it you can set the dimensions and output size like so:
// desired orientationconst orientation = OrientationPORTRAIT; // desired dimensions in CM (used for aspect ratio)const dimensions = PaperSizeLETTER; // your artwork { // your artwork... return outputSize: '300 dpi' }The outputSize option can be any of the following:
- a string with DPI resolution like
'300dpi'or'72 DPI' - a single number to use as the pixel width; in this case the height is computed automatically based on the
dimensionsaspect - an array of
[ width, height ], where either (or both) can be specified as pixel sizes. If you specify'auto',-1ornullas a dimension, it will be computed automatically based on the aspect ratio
The default output width is 1280 px.
Some Examples
In the example folder you will find some variations of plots.
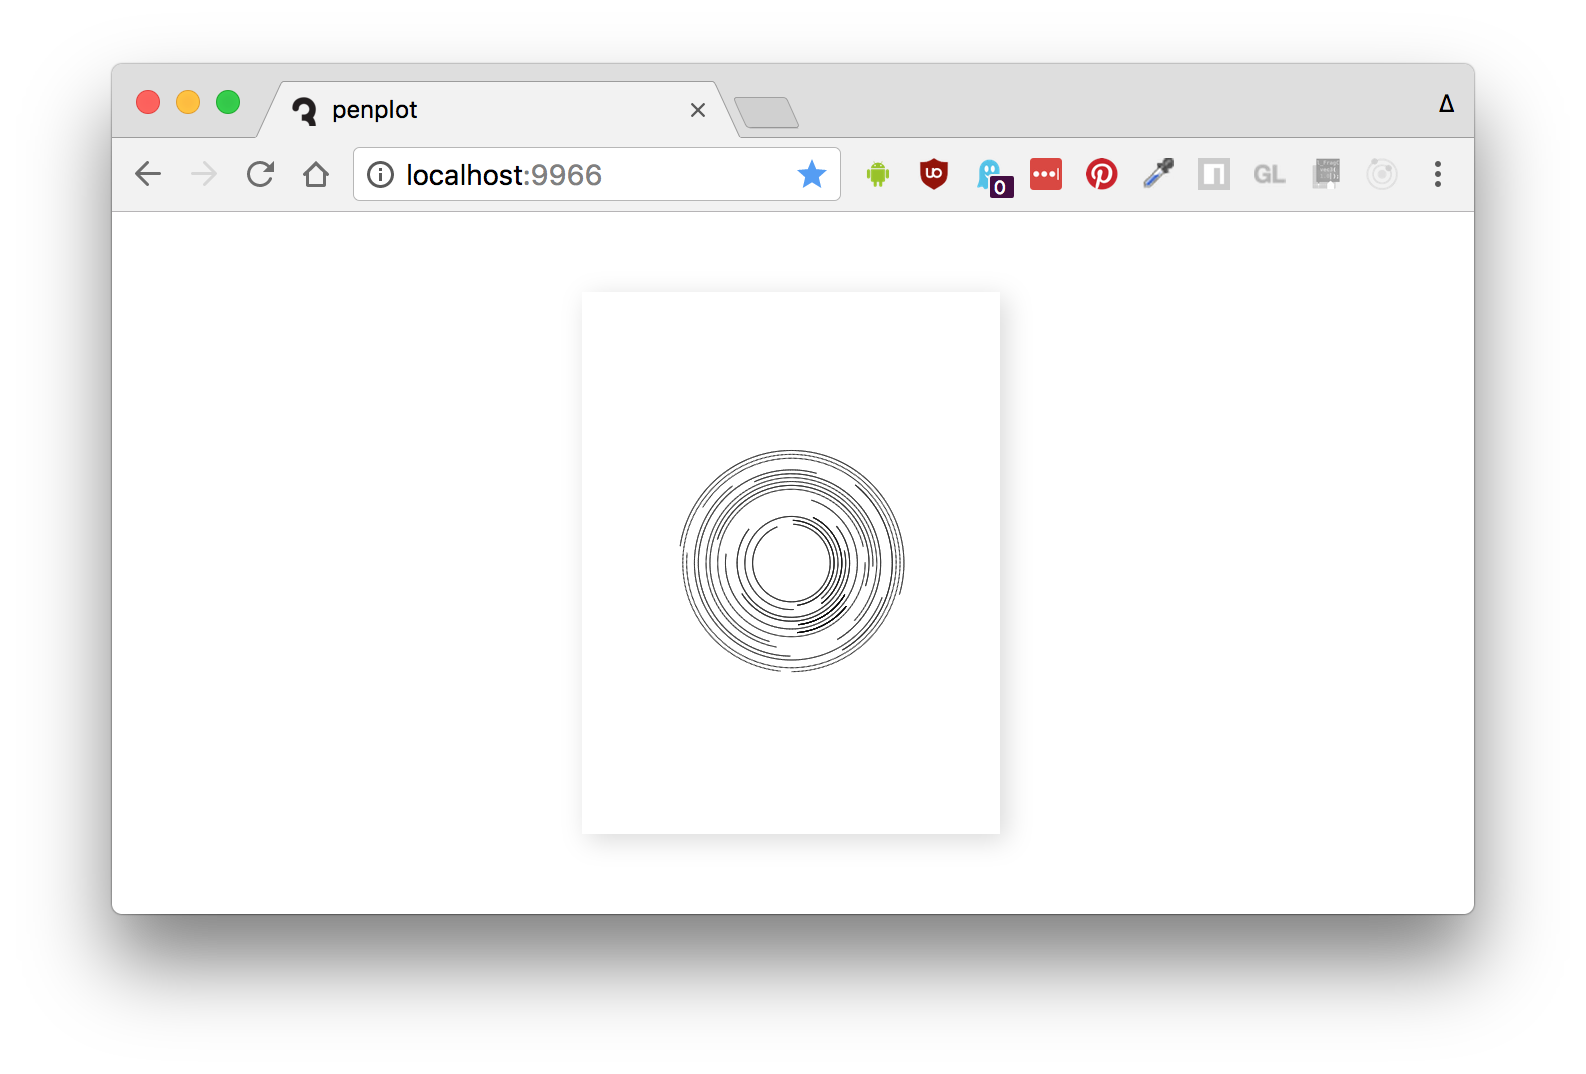
simple-circles.js

This example shows the basics of using penplot for hardware like AxiDraw V3. You can run it like so:
penplot example/simple-circles.js --openAnd hit Cmd/Ctrl + S or Cmd/Ctrl + P to save a PNG or SVG file, respectively.
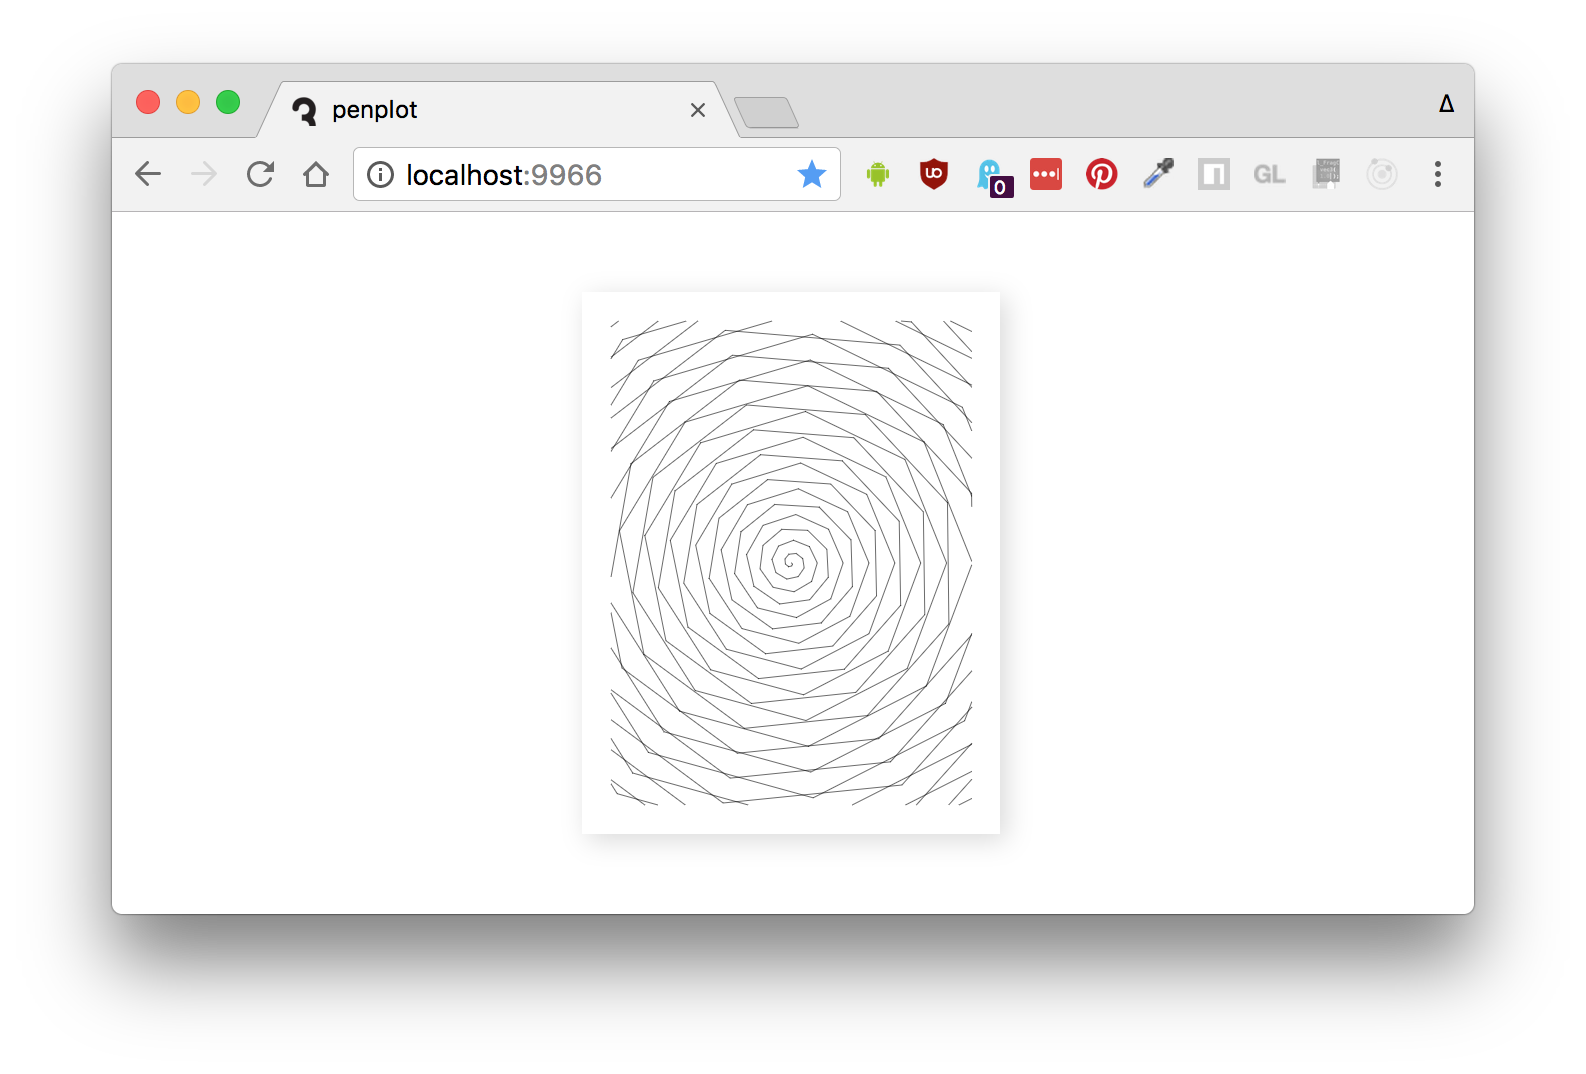
swirling-circles.js

This example shows how you can use a built-in function clipPolylinesToBox in penplot/util/geom.js to clip the lines to a margin.
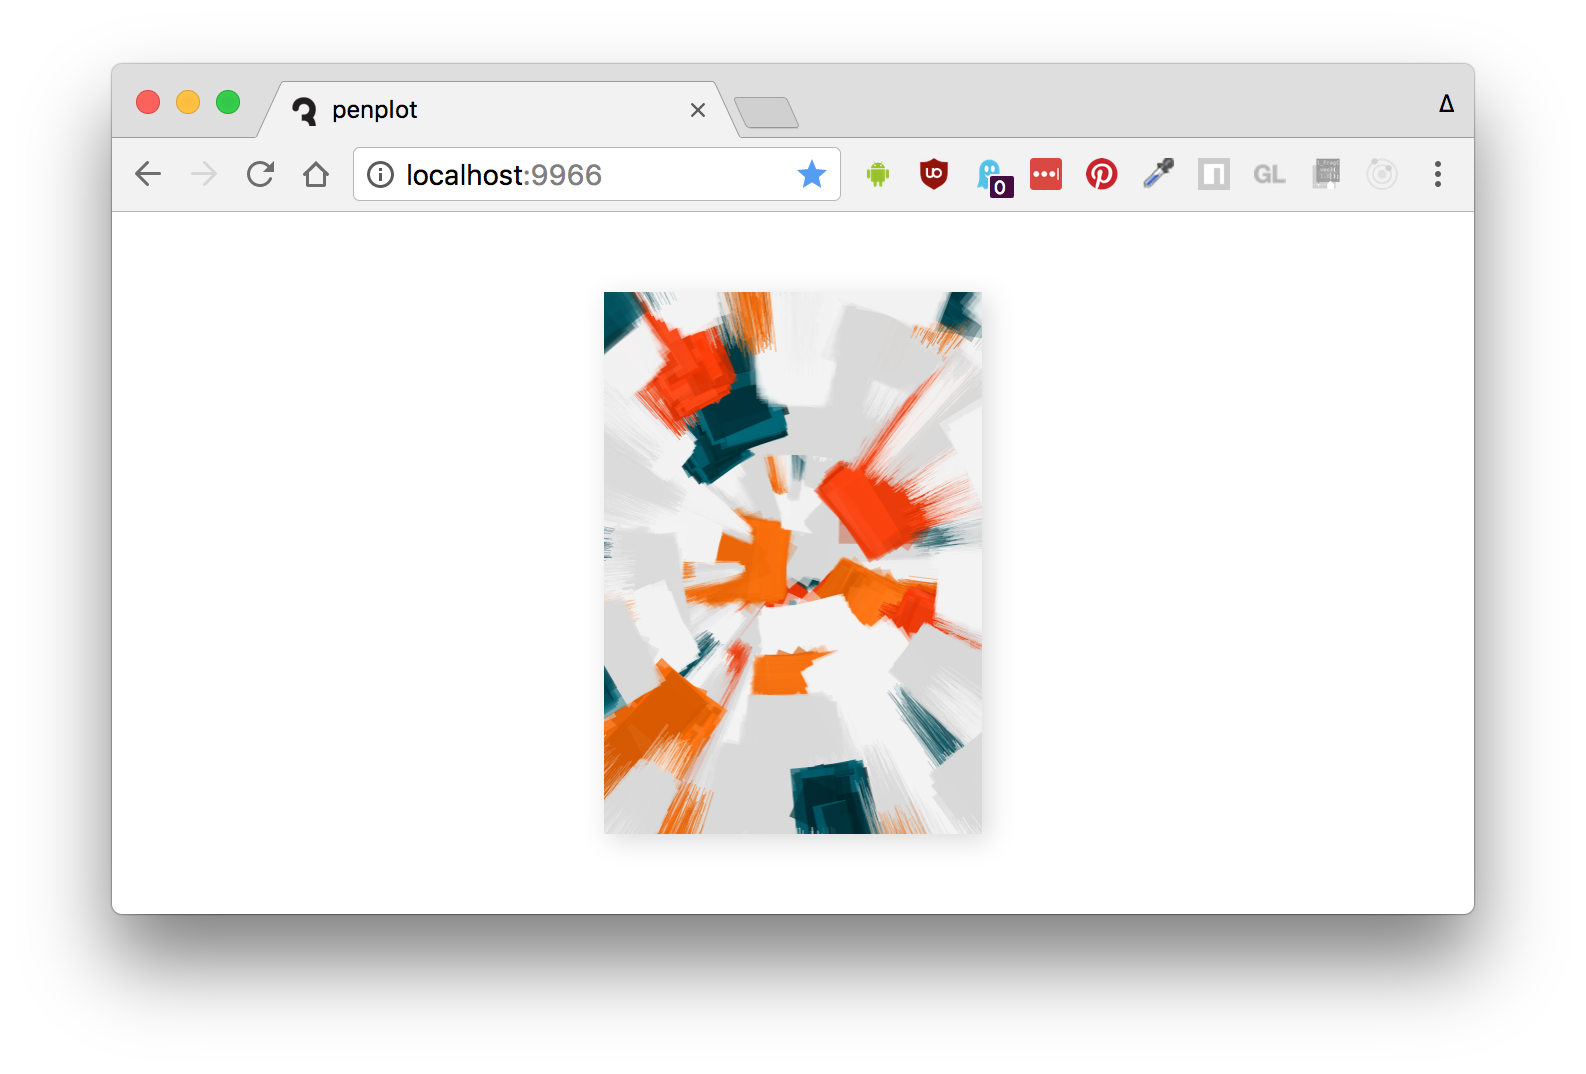
generative-paint.js

This example shows a more complex algorithmic artwork, and how you can use penplot as a development environment for print-size generative art even when you have no plans to print it to a pen plotter.
The outputSize parameter in this demo is set to '300 dpi', which will convert the dimensions and orientation to a pixel size suitable for print when saving to PNG.
License
MIT, see LICENSE.md for details.