
An effective and customizable calendar heatmap chart for React applications. This library helps you create a calendar heatmap, similar to Kite (Zerodha), Angel One, TradingView, but with additional powerful features:
- 🔀 Customizable date option
- 🗓️ Full control over layout and UI
- 🖥️ Plugin system for extended functionality
- ⚡ Lightweight with high speed
- ✅ Supports dynamic data updates
- ♾️ And many more...
Check out the live demo on CodeSandbox:
🔗 Live Demo
Install via npm or yarn:
npm install react-calendar-heatmap-chart
# or
yarn add react-calendar-heatmap-chart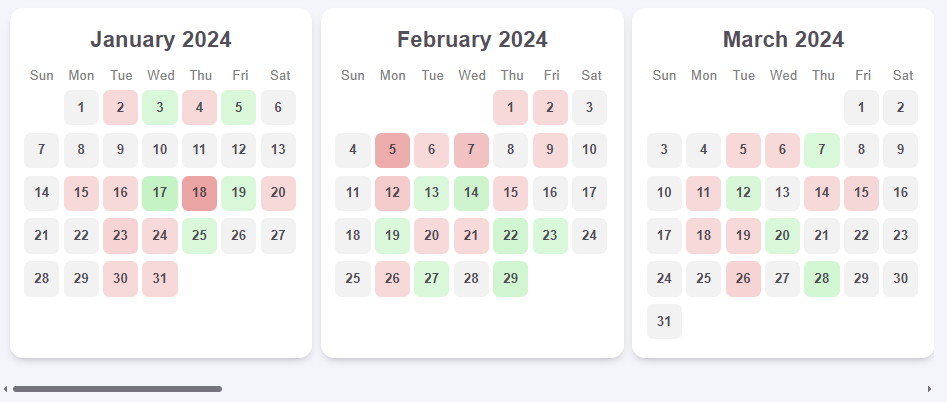
| Prop | Type | Description |
|---|---|---|
data |
Array | Array of objects containing date (YYYY-MM-DD) and net_profit_loss values. |
displayDate |
Boolean | If true, the date will be displayed on hover. |
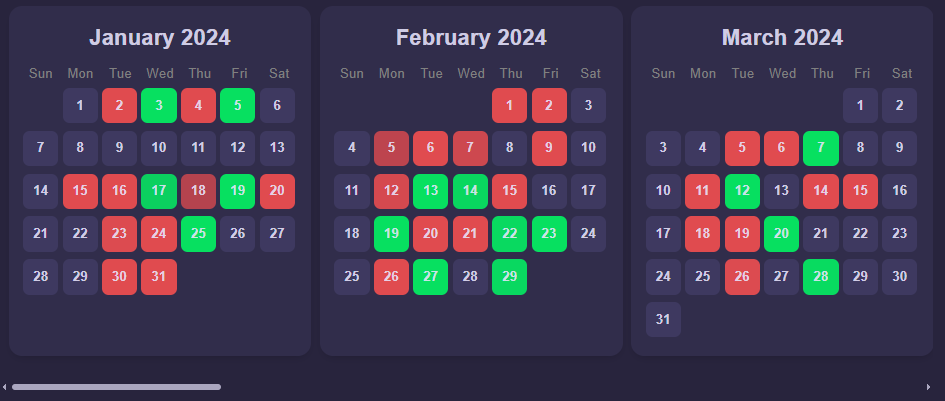
mode |
String | Theme mode, can be "light" or "dark". Defaults to "light". |
bgColor |
String | Background color of the heatmap. Accepts any valid CSS color value. |
import { HeatmapCalendarChart } from "react-calendar-heatmap-chart";

export default function Heatmap() {
  const data = [
    { date: "2025-01-06", net_profit_loss: -78 },
    { date: "2025-01-09", net_profit_loss: 79 },
    { date: "2025-01-27", net_profit_loss: -73 },
    { date: "2025-01-26", net_profit_loss: 82 },
    { date: "2025-01-08", net_profit_loss: 70 },
    { date: "2025-02-24", net_profit_loss: 58 },
    { date: "2025-02-08", net_profit_loss: -81 },
    { date: "2025-02-28", net_profit_loss: 16 },
    { date: "2025-02-04", net_profit_loss: 75 },
    { date: "2025-02-17", net_profit_loss: 15 },
  ];

  return (
    <HeatmapCalendarChart
      mode="dark"
      data={data}
      displayDate={true}
      bgColor={"#28243D"}
    />
  );
}This project is licensed under the MIT License.
Contributions, issues, and feature requests are welcome! Feel free to check issues and make pull requests.
If you have any questions, need clarification, or want to discuss something related to the project, feel free to reach out:
- Email: jenishgojariya@gmail.com
- LinkedIn: Jenish Gojariya
- GitHub: jenishgojariya