react-simple-heatmap
A simple React component to create responsive heatmap. To be rendered, this heatmap only need a dataset (2D Array) and a parent element which have a width and height. There is more customization available.

![]()
Install
yarn add react-simple-heatmapor
npm install react-simple-heatmap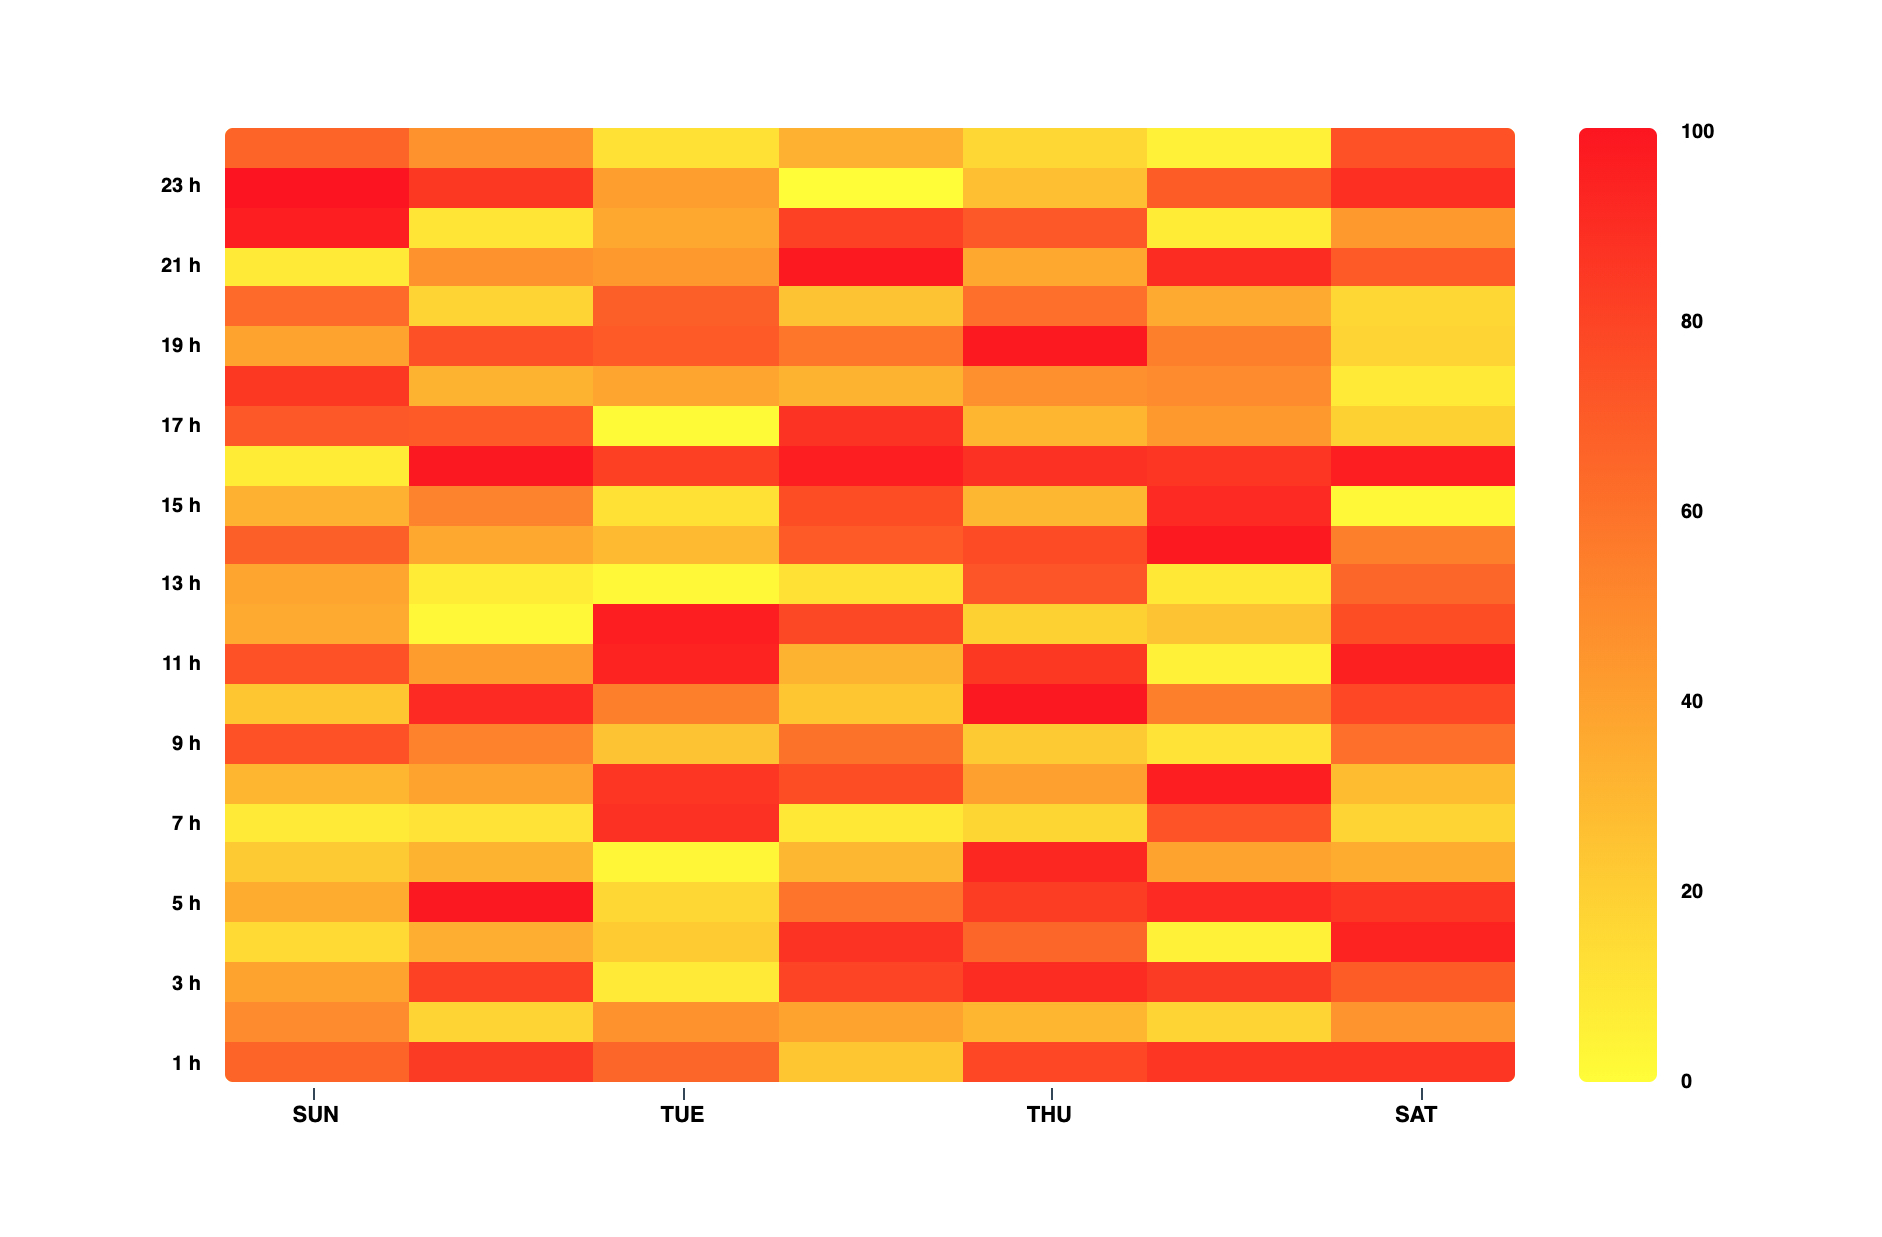
Demo
Obligatory Fields
| Name | Type | description | example | default |
|---|---|---|---|---|
| data | 2D Array of numbers | 2D Matrix of numbres | [[10,12,33], [2,45,31], [16, 32, 29]] | undefined |
Basic Example:
import React Component from "react"import Heatmap from "react-simple-heatmap" { // 2D array of numbers const data = 10 12 33 21 45 31 16 32 29; return <div => <Heatmap = /> </div> ; }Customization fields
| Name | Type | description | example | default |
|---|---|---|---|---|
| bgColors | Array of 2 colors | Main color using RGB format |
["rgb(255, 11, 11)", "rgb(255, 255, 0)"] |
["rgb(24, 144, 255)", "rgb(255, 255, 255)"] |
| xLabels | Array | Display the X-axis labels | ["SUN", "MON", "TUE", "WED", "THU", "FRI", "SAT"] |
undefined |
| yLabels | Array | Display the Y-axis labels | [1, 2, 3, 4, 5, 6, 7, 8, 9, 10] |
undefined |
| showLegend | Bollean | Display the heatmap legend. | true |
false |
| onClick | Function | Adding an handler to cell click | (data, x, y) => alert(`Data: ${ data }, X: ${ x }, Y: ${ y }\`) | undefined |
|
| showData | Bollean | Display data inside each cells. | true |
false |
| bordered | Bollean | Display a border on the heatmap. | false |
true |
| xStepLabel | Number | Show the label if his index in the xLabels array modulo xStepLabel equals 0 | 2 |
undefined |
| yStepLabel | Number | Show the label if his index in the yLabels array modulo yStepLabel equals 0 | 2 |
undefined |
| showTicks | Boolean or String | Show the ticks lines of the label. Use true to show X-axis and Y-axis ticks, "y" to show only Y-axis ticks and "x" to show only X-axis ticks. |
"y" |
false |
| xLabelsStyle | Object | Style your X-axis labels. | { fontWeight: "bold" } |
{} |
| yLabelsStyle | Object | Style your Y-axis labels. | { fontWeight: "bold" } |
{} |
| legendStyle | Object | Style your Legeng labels. | { fontWeight: "bold" } |
{} |
| borderRadius | String | Add border radius to the heatmap and legend | "4px" |
0 |
Customization example
import React Component from 'react'import Heatmap from 'react-simple-heatmap' // Creating a 2D array (7 x 24)const size = 7;const data = ;forlet i = 0; i < size; i++ const temp = ; forlet i = 0; i < 24; i++ temp; data; { // Create an array of for the Y labels const yLabels = ; forlet i = 0; i < 24; i++ yLabels; return <div ="App"> <div = > datalength > 0 && <Heatmap = = = = = = = = = = = = = = /> </div> </div> ; } License
MIT © Julien Rioux