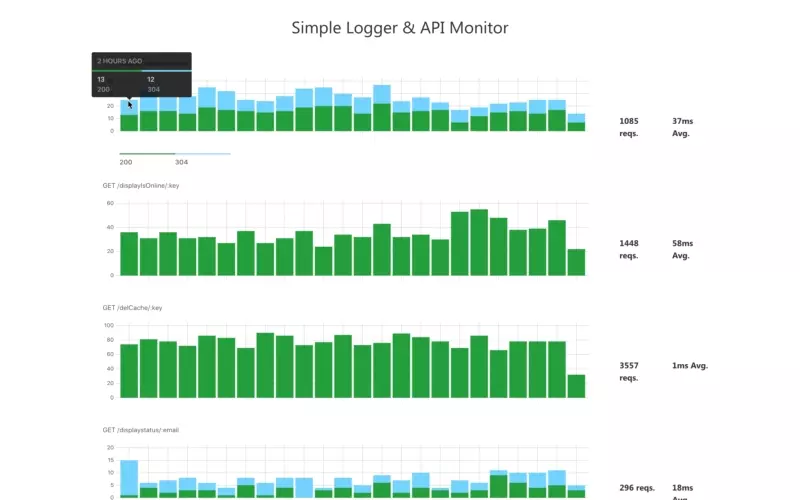
Add an API monitoring page to your Express app in 3 seconds. Visualizes requests over time, with average response times and error rates.
npm i -s simple-logger-api-monitor
Add the following line before your Express routes (ensuring you pass your app to this module):
require('simple-logger-api-monitor')(app);
This will add a new global, global.slamCounts, and two new routes: GET /slamCounts & GET /monitor. Additionally, a middleware will track each request, and log statistics about each request. Overhead should not be noticeable, even with heavy traffic.
You do not need to monitor your app to use this page. Simply visit the /monitor route of your application to view usage statistics for your app API routes. Detailed statistics are kept for 2 hours. Data is purged each time your app restarts. Clustering is supported.
Currently, you can pass an environment variable HOSTNAME or SLAM_HOSTNAME (namespace safe) to set the hostname of your apis (optional).
You can also customize your monitor page title and path via environment variables.
Additionally, you can enable or disable logging, especially of slow requests.
SLAM_MONITOR_PATH='/monitor'
SLAM_PAGE_TITLE='API Monitor'
SLAM_LOG_LONG_REQUESTS=true
SLAM_MAX_REQUEST_LENGTH=5000
SLAM_DEBUG=false
- Make the monitoring page configurable
- [x] Custom title
- [x] Custom route
The intent is for this to remain very simple and easy to use, so the scope of features is intentionally small.
However, If you run in to any issues feel free to open an issue.
Contributions welcome! Please open an Issue before creating a pull request.
