Smooth line graph
A React library for rendering line graphs, based on SVG.
Usage
This module consists of a React component, which is the default export.
A basic dot-to-dot graph can be achieved as follows:
;;; const props = name: 'simple' width: 300 height: 300 lines: key: 'mykey' data: 0 0 1 1 2 4 3 9 4 16 5 25 6 36 7 49 color: 'black' ; ;This results in the following SVG being rendered:

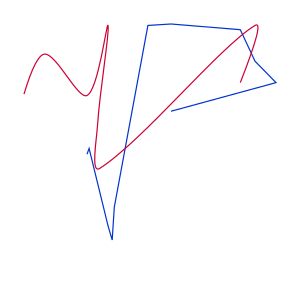
Multiple lines can be passed, with optional smoothing effects. For example:
;;; const props = name: 'multi' width: 500 height: 500 padding: 40 40 100 40 lines: key: 'series1' data: 0 0 01 04 1 -5 12 -6 13 -37 29 9 4 91 73 87 8 65 9 5 4 3 color: '#03c' smooth: false key: 'series2' data: -3 42 -2 7 0 41 1 9 05 2 06 -1 8 9 73 5 color: '#c03' smooth: true ; ;results in the following:
More examples can be found in the examples directory.
Options
Properties passed direct to <LineGraph /> are the following:
- (required)
name: the class name of the graph - (required)
width: the displayed width (in pixels) of the graph - (required)
height: the displayed height (in pixels) of the graph - (required)
lines: an array of line objects (see line options) - (optional)
beforeLines: a React component to render inside the SVG and before the rendered lines - (optional)
afterLines: a React component to render inside the SVG and after the rendered lines - (optional)
beforeGraph: a React component to render before the SVG - (optional)
afterGraph: a React component to render after the SVG - (optional)
minX: minimum X value in scale (this will be calculated from the data otherwise) - (optional)
maxX: maximum X value in scale (this will be calculated from the data otherwise) - (optional)
minY: minimum Y value in scale (this will be calculated from the data otherwise) - (optional)
maxY: maximum Y value in scale (this will be calculated from the data otherwise) - (optional)
outerProperties: an object containing additional properties to pass to the outer<div /> - (optional)
svgProperties: an object containing additional properties to pass to the<svg /> - (optional)
svgClasses: a string to render as a class name on the<svg />
Note that all of the above props are passed into each outerProperties and svgProperties item, so you could do something like this:
<LineGraph ...props outerProperties= `Graph width: px` />Also note that all of the above props, plus the following additional ones, are passed to beforeLines, afterLines, beforeGraph and afterGraph, and that they are guaranteed to receive minX, maxX, minY and maxY:
pixX: a function mapping X values to their corresponding rendered positionpixY: a function mapping Y values to their corresponding rendered positionvalX: a function mapping X pixels to their corresponding valuevalY: a function mapping Y pixels to their corresponding value
Line options
The lines prop passed to <LineGraph /> should be an array of objects, defining each line. The following list of options can be used as properties on each line object:
- (required)
key: a unique key to identify this line - (required)
data: an array of points (which are two-length arrays like [xValue, yValue]) - (required)
color: either:-
a string (e.g.
blackor#073199), or -
a function like
([xValue, yValue], index) => color, where:indexis the index of the point we are currently drawing a line fromxValueis its X valueyValueis its Y valuecoloris a string likeblackor#073199
This determines a line which can change colour dynamically, based on the position and values of its data.
-
- (optional)
strokeWidth: the number of pixels wide the line should be - (optional)
fill: (boolean) whether or not to fill the line from 0 (useful mostly on time series) - (optional)
smooth: (boolean) whether or not to render the line as a smoothed cubic bezier curve - (optional)
arrows: (boolean) whether or not to draw the line as a list of arrows (useful mostly on time series - see thearrowsexample to see this in action)
Time graph
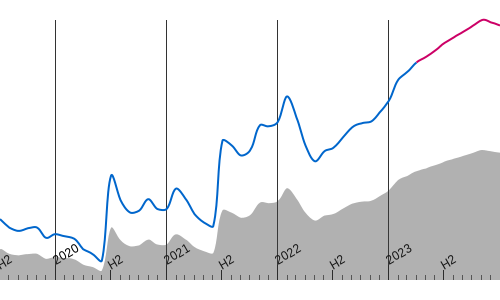
Including an additional startTime prop, will render a time series with a horizontal time axis.
Note that startTime and all the X-series values for the lines should be UNIX timestamps (i.e. the number of seconds since the UNIX epoch).
You can find an example of a time series graph in examples/time.js, which renders the following:
Testing
Tests are written using the mocha framework, and cover both unit tests and graph tests. The graph tests were written post-hoc - i.e. examples were written and then run, the results were verified visually, and then the tests were written to conform to these results.
To run all tests, use:
npm test