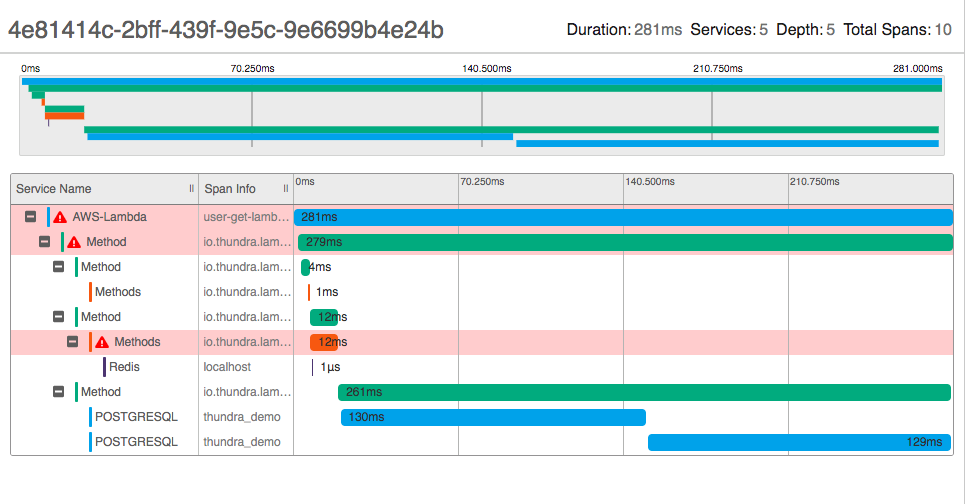
Thundra-Trace-Chart
thundra-trace-chart is a React component to render open-tracing compatible traces and spans in a similar way to popular tools like Jeager and Zipkin. This component is using the project zipkin-lens in its roots.
This component is under development and may not be the best solution for a custom use case. So you may want to fork it, or we would be happy to accept your PR's.
For npm audit logs to save use this command;
npm audit --no-unicode --no-color > "npm-audit-log-$(date +%s).txt"
tl;dr
- Install by executing
npm install --save thundra-trace-chartoryarn add thundra-trace-chart. - Import by adding
import ThundraTraceChart from 'thundra-trace-chart'. - Use by adding
<ThundraTraceChart {...someProps} />.
Demo
Minimal demo page is included in sample directory. You just need to clone the repo and run npm i then finally run npm start to see the demo on your machine.
Online demo will be available soon!
Installation
Add Thundra-Trace-Chart to your project by executing npm install --save thundra-trace-chart or yarn add thundra-trace-chart.
Usage
Here's an example of basic usage:
import React, { Component } from 'react';
import ThundraTraceChart from 'thundra-trace-chart';

class MyApp extends Component {

  sampleTrace = () => {
    let trace = [
      {
        traceId: '4e81414c-2bff-439f-9e5c-9e6699b4e24b',
        parentId: '',
        id: '9400a8a9-9650-4312-9514-d4bbc1114a97',
        name: 'user-get-lambda-java-es',
        timestamp: 1557761782905000,
        duration: 281000,
        serviceName: 'AWS-Lambda',
        tags: {
          error: true
        }
      }
    ]

    return trace;
  }

  render() {
    return (
      <div>
        <ThundraTraceChart
          traceId="4e81414c-2bff-439f-9e5c-9e6699b4e24b"
          traceSummary={this.sampleTrace()}
        />
      </div>
    );
  }
}
User guide
Props
| Prop name | Prop type | Default | Description |
|---|---|---|---|
| traceId | string | required | Common trace id to all spans. |
| traceSummary | array of objects | required | Array of objects, that each object contains vital information to render a single span. |
| spanDetails | object | { } | Set of key value pairs. Keys are id values of each object in the traceSummary array. Values are the React elements to render when spans clicked and span details are shown. |
| spanHighlights | array of string | [ ] | Array of span ids from trace summary array. When provided, these traces will rendered to be more distinctive than other spans. |
| activeSpanIds | array of string | [ ] | Array of span ids from trace summary array. When provided, details of these spans will be rendered as open. You can not use this prop with spanHighlights together. |
| showHeader | boolean | true | Shows a header to top of the chart showing traceId, duration etc. |
| showMiniTrace | boolean | true | Shows a mini trace chart on top. Useful to see if you have many spans. |
| showTraceChartHeader | boolean | true | Shows a header over the spans. Useful to set width of Service Name or Span Info columns. |
| showSpanDetail | boolean | true | Opens spans towards the below to show more detailed info about that span. |
| showSpanDetailTitle | boolean | true | Render a title when span details is shown. |
| serviceNameColumnTitle | string | Service Name | Sets custom title for Service Name column. |
| spanInfoColumnTitle | string | Span Info | Sets custom title for Span Info column. |
| onSpanClicked | function(spanId) | ( ) | When implemented, this function is called with the recently clicked span's id. |
Trace Object
Each of the trace object provided to traceSummary array has its own special structure.
| Key name | Type | Description |
|---|---|---|
| traceId | string | Common trace id to all spans. |
| parentId | string | Parent span id of the span. |
| id | string | Unique id of the span. |
| serviceName | string | Name to be showed under Service Name column. |
| name | string | Info to be showed under Span Info column. |
| timestamp | number | Time info in microseconds to show when span is started. |
| duration | number | Duration of the span. |
| color | string | Color string as a valid hexcode. |
| tags | object | Any extra info to provided to the span, i.e: error |

