aio-table (React js all in one table)
aio table options
- data table
- tree table
- support nested data
- support flat data
- keyboar navigation
- inline edit
- group by
- sortable
- filterable
- searchable
- use html or jsx in cells
- freeze mode
- resize columns
- swap columns position
- mobile support
- paging
Installation
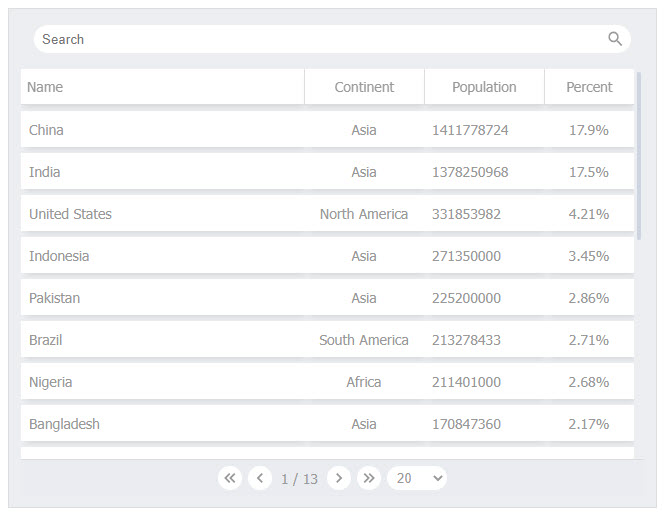
Basic
countries JSON as aio table model:
[
  ...
  {
      "continent":"North America",
      "name":"United States",
      "population":"331853982",
      "percent":"4.21",
      "update":"16 Jun 2021"
  },
  ...
]
also you can find contries json in repository (countries.js)
import React,{Component} from "react";
import Table from 'aio-table';
import countries from './countries';
import "./style.css";

export default class App extends Component {
  state = {model:countries}
  render(){
    let {model} = this.state;
    return (
      <Table
        className='table'
        model={model}
        columns={[
          {
            title:'Name',
            getValue:(row)=>row.name,
            justify:false,
            titleJustify:false,
            search:true
          },
          {
            title:'Continent',
            getValue:(row)=>row.continent,
            width:120,
          },
          {
            title:'Population',
            getValue:(row)=>row.population,
            justify:false,
            width:120,
          },
          {
            title:'Percent',
            getValue:(row)=>row.percent,
            template:(row)=>row.percent + '%',
            width:90,
          }
        ]}
        paging={{
          number:1,
          size:20,
        }}
        padding={12}

      />
    );
  }
}
main props:
| props |
type |
default |
description |
| model |
json |
Required |
data model of table as rows. |
| columns |
array of objects |
Required |
list of table columns. |
| paging |
object |
optional |
configure table paging. |
| groups |
array of objects |
optional |
grouping rows. |
| sorts |
array of objects |
optional |
sorting rows |
| className |
string |
optional |
class name of table. |
| id |
string |
optional |
id of table. |
| style |
css object |
optional |
set table css style. |
| padding |
number |
12 |
set table padding using padding props.(for better styling dont set padding in style instead set padding props) |
| headerHeight |
number |
36 |
height of header. |
| rowHeight |
number |
36 |
height of cells. |
| rowGap |
number |
6 |
gap between rows. |
| columnGap |
number |
0 |
gap between columns. |
each column Object:
| column property |
type |
default |
description |
| title |
string |
"" |
title of column. |
| getValue |
function |
optional if you set template property on column |
get row object as parameter and returns value of table cell based on row. |
| titleJustify |
boolean |
true |
justifying column title. |
| justify |
boolean |
true |
justifying cell content. |
| search |
boolean |
false |
put search input in toolbar for searching rows based on column values. |
| width |
number or string or 'auto' |
auto |
set width of column |
| minWidth |
number or string |
optional |
set min width of column(use in resizing column) |
| template |
function |
optional |
get row as parameter and return cell html |
| resizable |
boolean |
false |
make column resizable |
| movable |
boolean |
false |
male column movable. (swaping columns) |
| show |
boolean |
true |
set column visibility |
| toggleShow |
boolean |
false |
set visibility of column by user from toolbar |
| before |
function |
optional |
get row as parameters and returns html as before cell content |
| after |
function |
optional |
get row as parameters and returns html as after cell content |
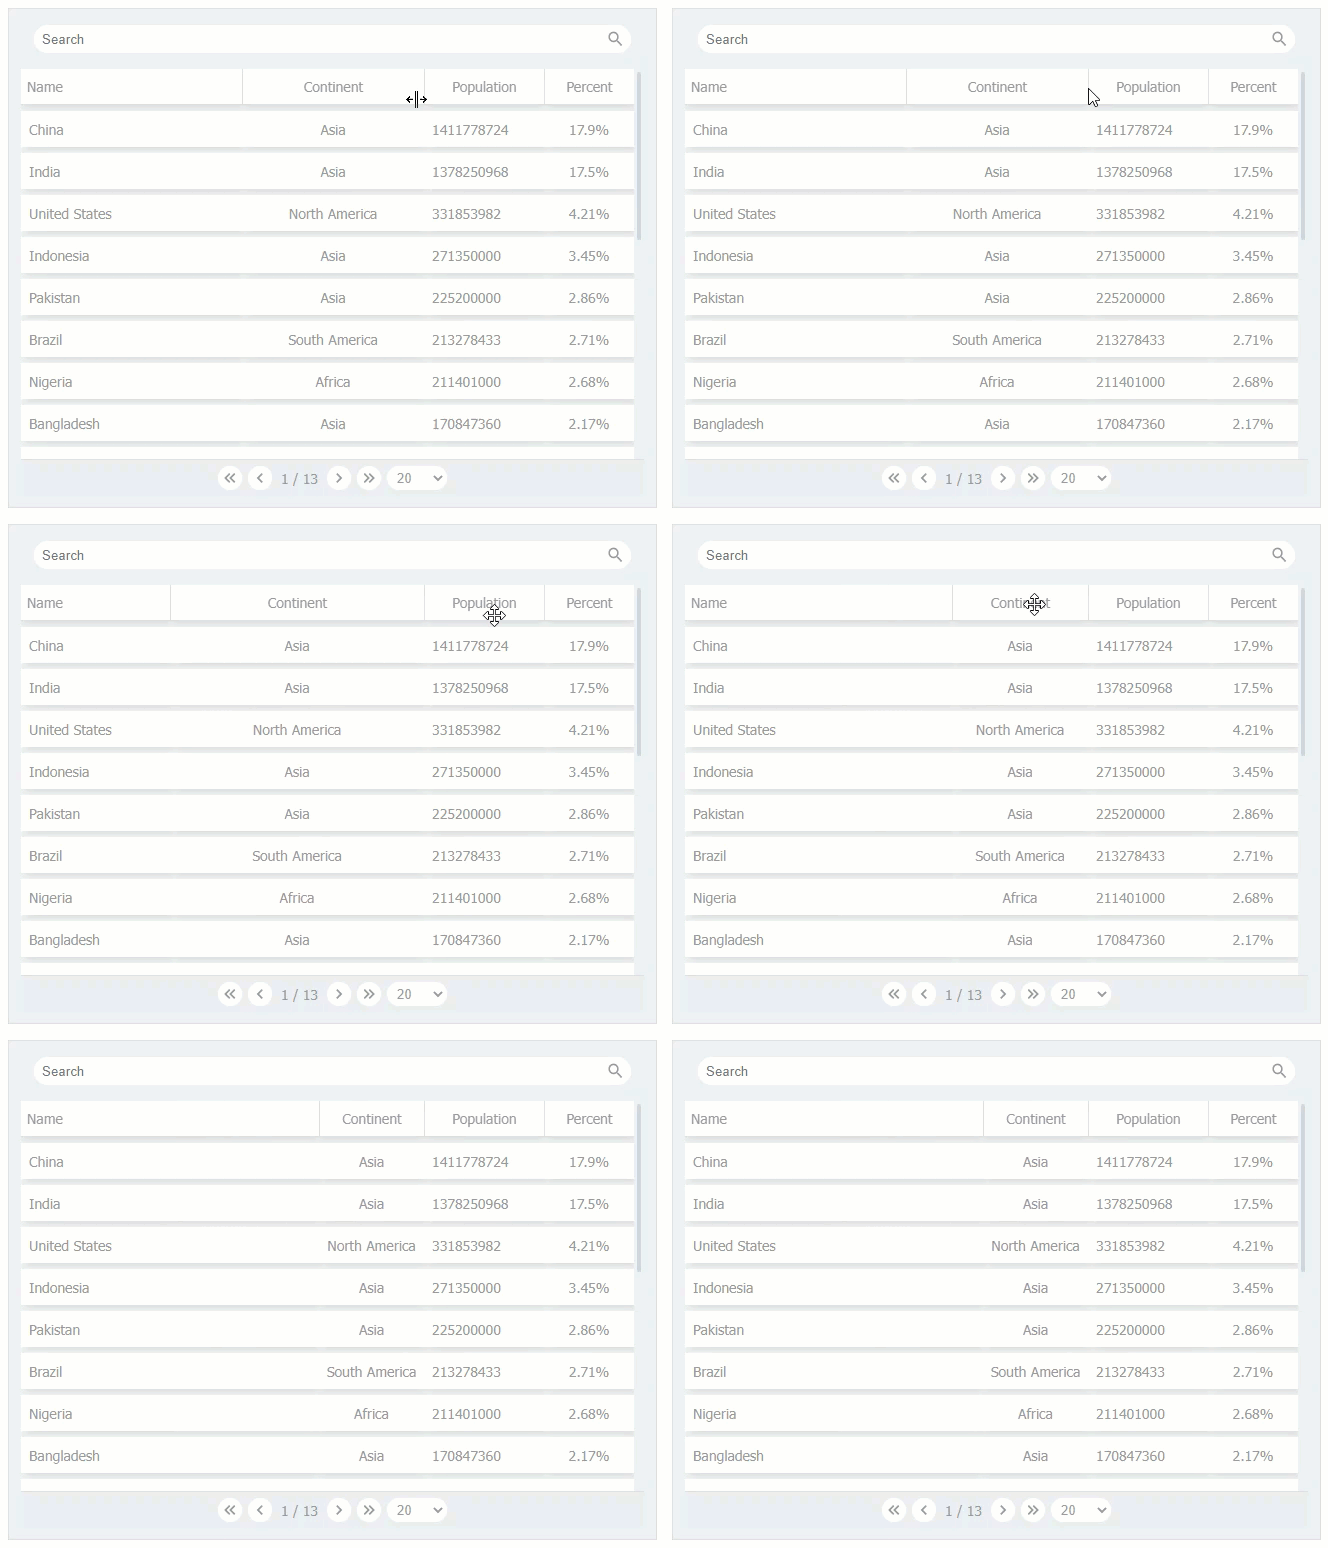
Set column resizable
<Table
  ...
  columns={[
    ...
    {
      title:'Continent',
      getValue:(row)=>row.continent,
      width:120,
      resizable:true
    },
    ...
  ]}
  ...
/>
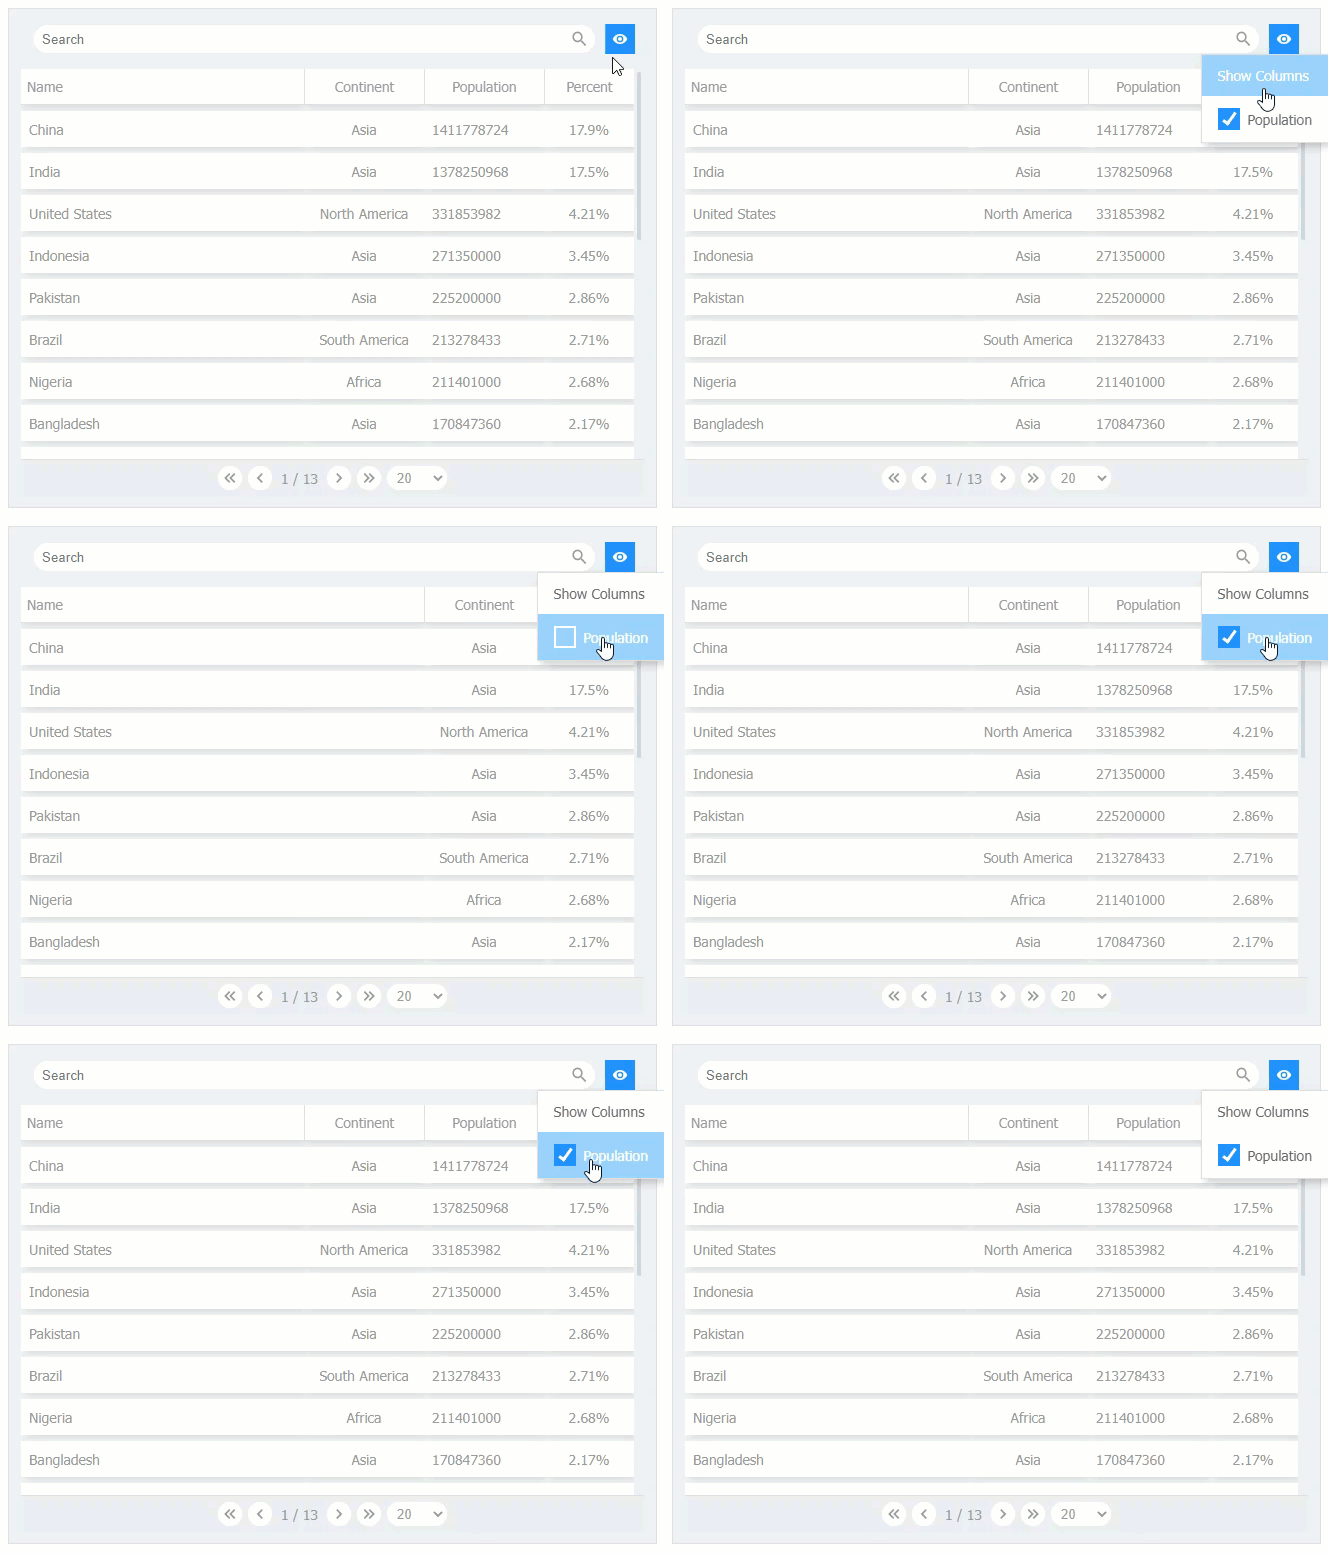
Set column toggleShow
<Table
  ...
  columns={[
    ...
    {
      title:'Population',
      getValue:(row)=>row.population,
      justify:false,
      width:120,
      toggleShow:true
    },
    ...
  ]}
  ...
/>
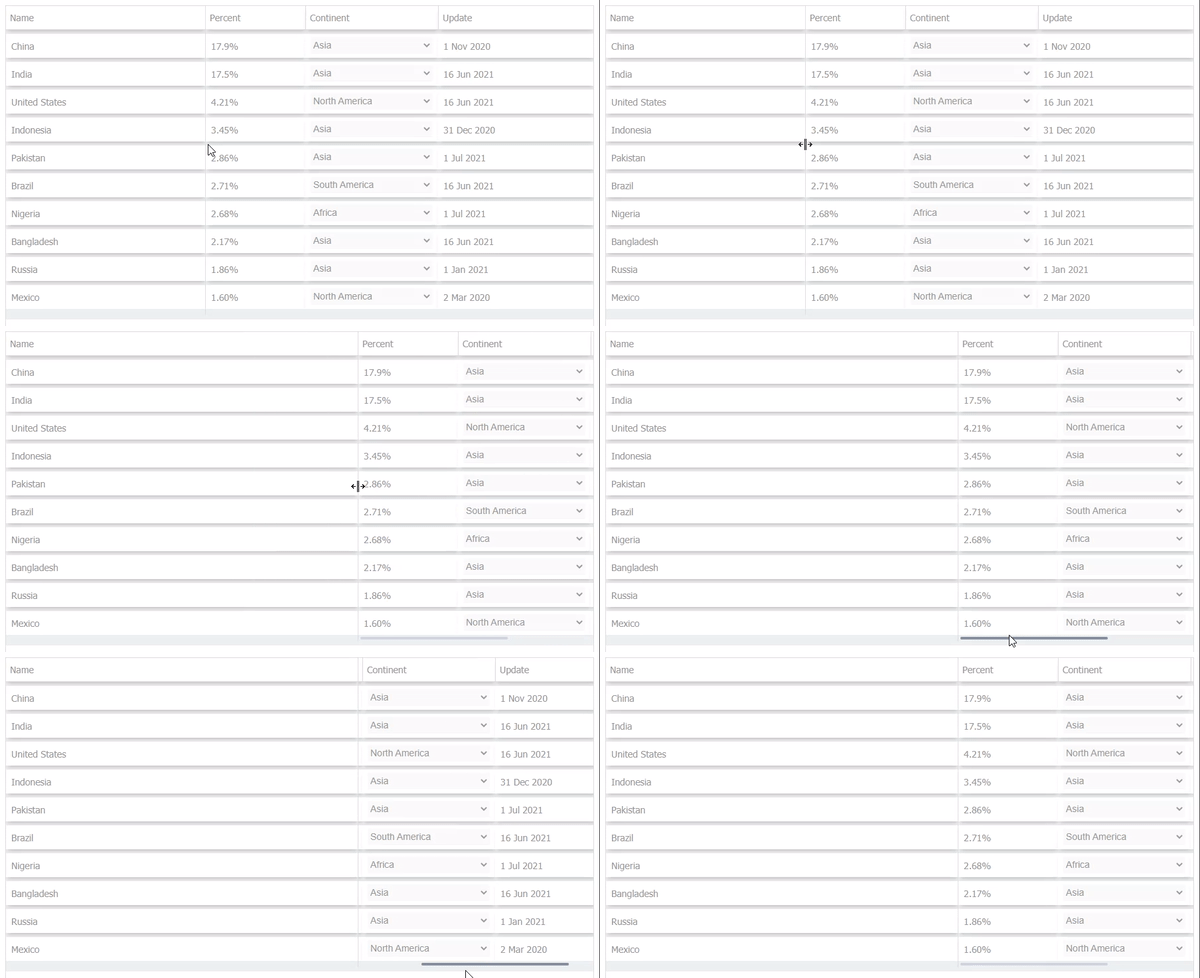
Set column freeze (boolean)
default is false
<Table
  ...
  columns={[
    ...
    {
      title:'Name',
      getValue:(row)=>row.name,
      width:'auto',
      freeze:true
    },
    ...
  ]}
  ...
/>
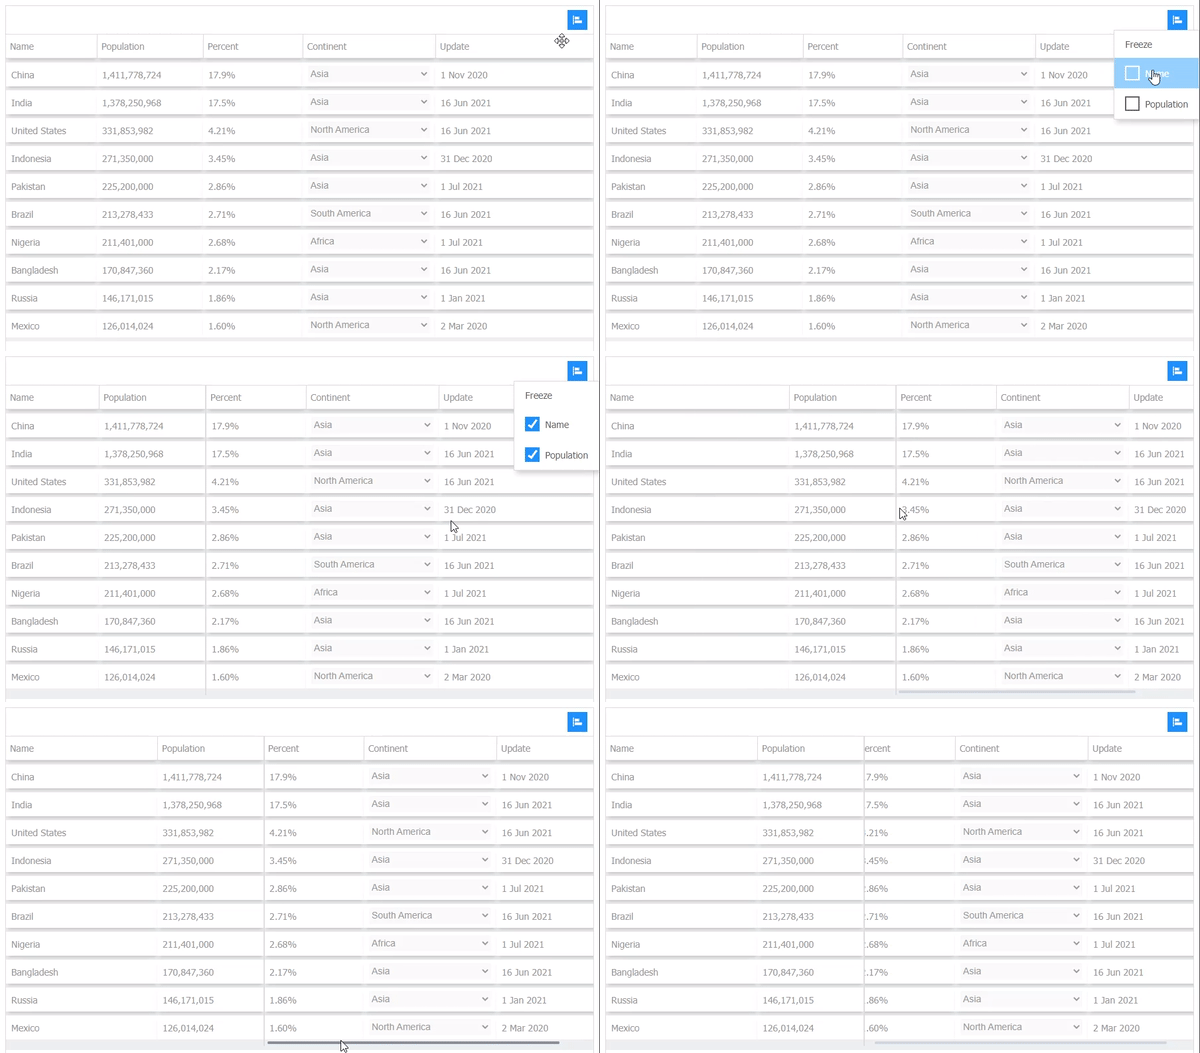
Set column toggleFreeze (boolean)
if true user can set column freeze from toolbar.
default is false
<Table
  ...
  columns={[
    ...
    {
      title:'Name',
      getValue:(row)=>row.name,
      width:'auto',
      toggleFreeze:true
    },
    {
      title:'Population',resizable:true,
      getValue:(row)=>row.population,
      template:(row)=>numberWithCommas(row.population),
      width:'160px',
      toggleFreeze:true
    }
    ...
  ]}
  ...
/>
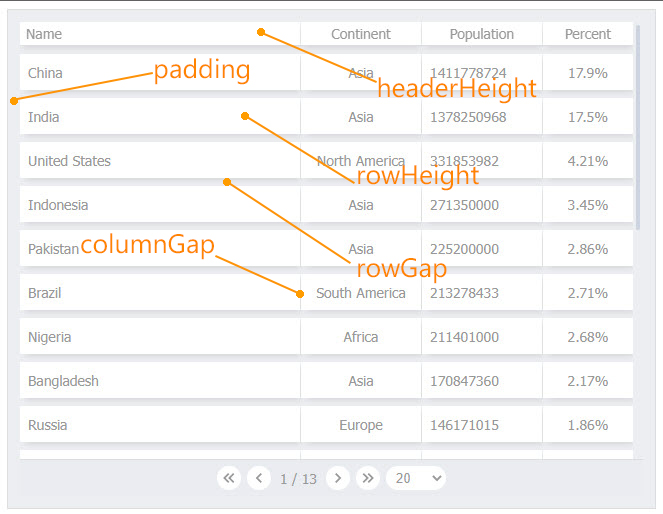
sizing props (headerHeight,rowHeight,rowGap,columnGap,padding)
default value is 36
<Table
  ...
  headerHeight={24}
  rowHeight={36}
  rowGap={8}
  columnGap={1}
  padding={12}
  ...
/>
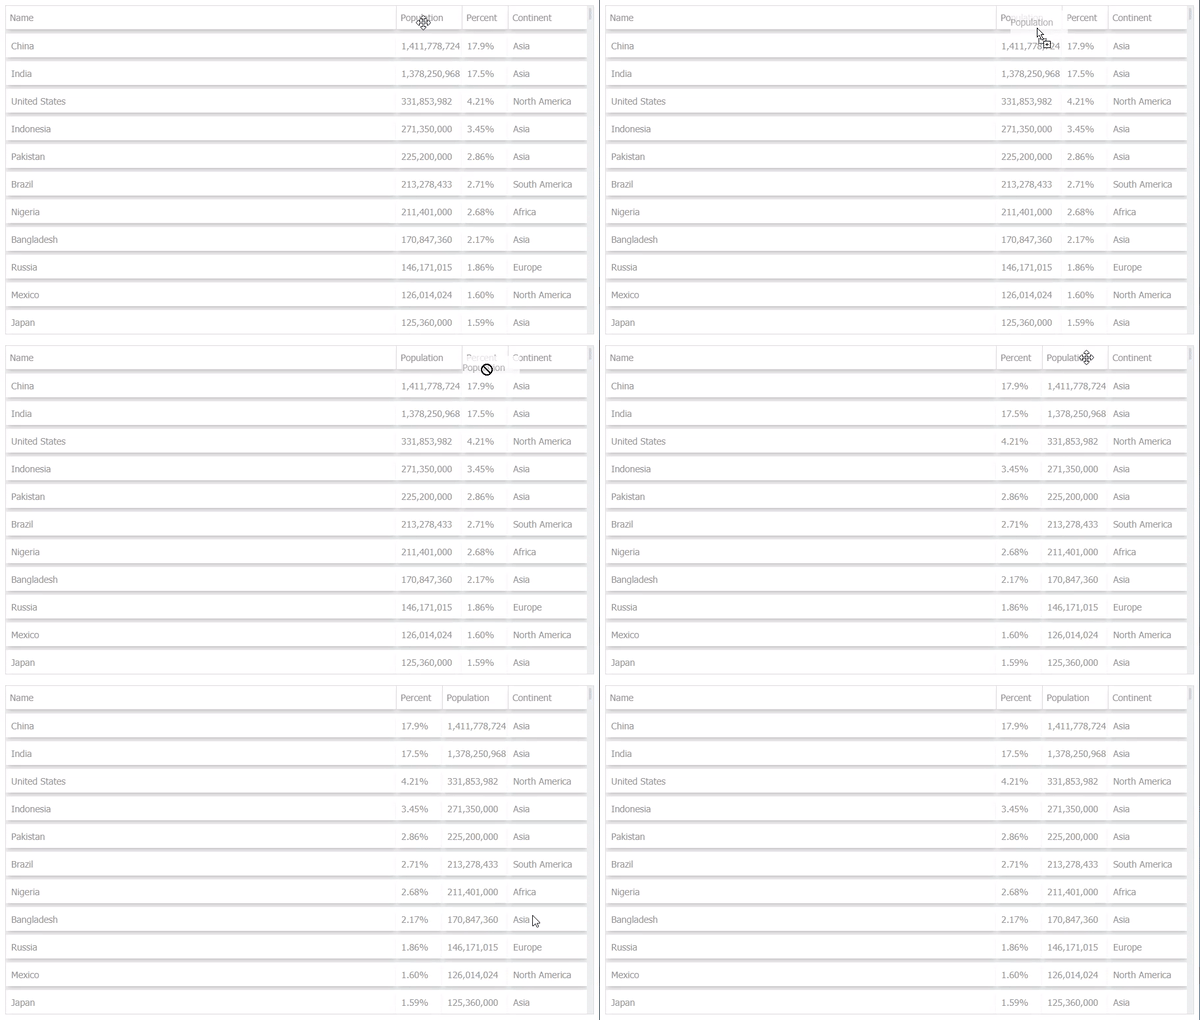
set column movable (boolean)
drag and drop movable columns to swap and reorder.
default is true
for prevent move column set movable property false on column object
<Table
  ...
  columns={[
    ...
    {
      title:'Population',
      getValue:(row)=>row.population,
      movable:false
    }
    ...
  ]}
  ...
/>
set column filter (object)
filter rows by column value automatically.
for filter rows based on column , getValue property is required on column.
| property |
type |
default |
description |
| type |
string ('text' or 'number') |
'text' |
based on column values. |
<Table
  ...
  columns={[
    {
      title:'Name',
      getValue:(row)=>row.name,
      justify:false,
      titleJustify:false,
      filter:{type:'text'}
    },
    {
      title:'Continent',
      getValue:(row)=>row.continent,
      width:120,
      resizable:true,
    },
    {
      title:'Population',
      getValue:(row)=>row.population,
      justify:false,
      width:120,
      filter:{type:'number'}
    },
    {
      title:'Percent',
      getValue:(row)=>row.percent,
      template:(row)=>row.percent + '%',
      width:90,
    }
  ]}
  ...
/>
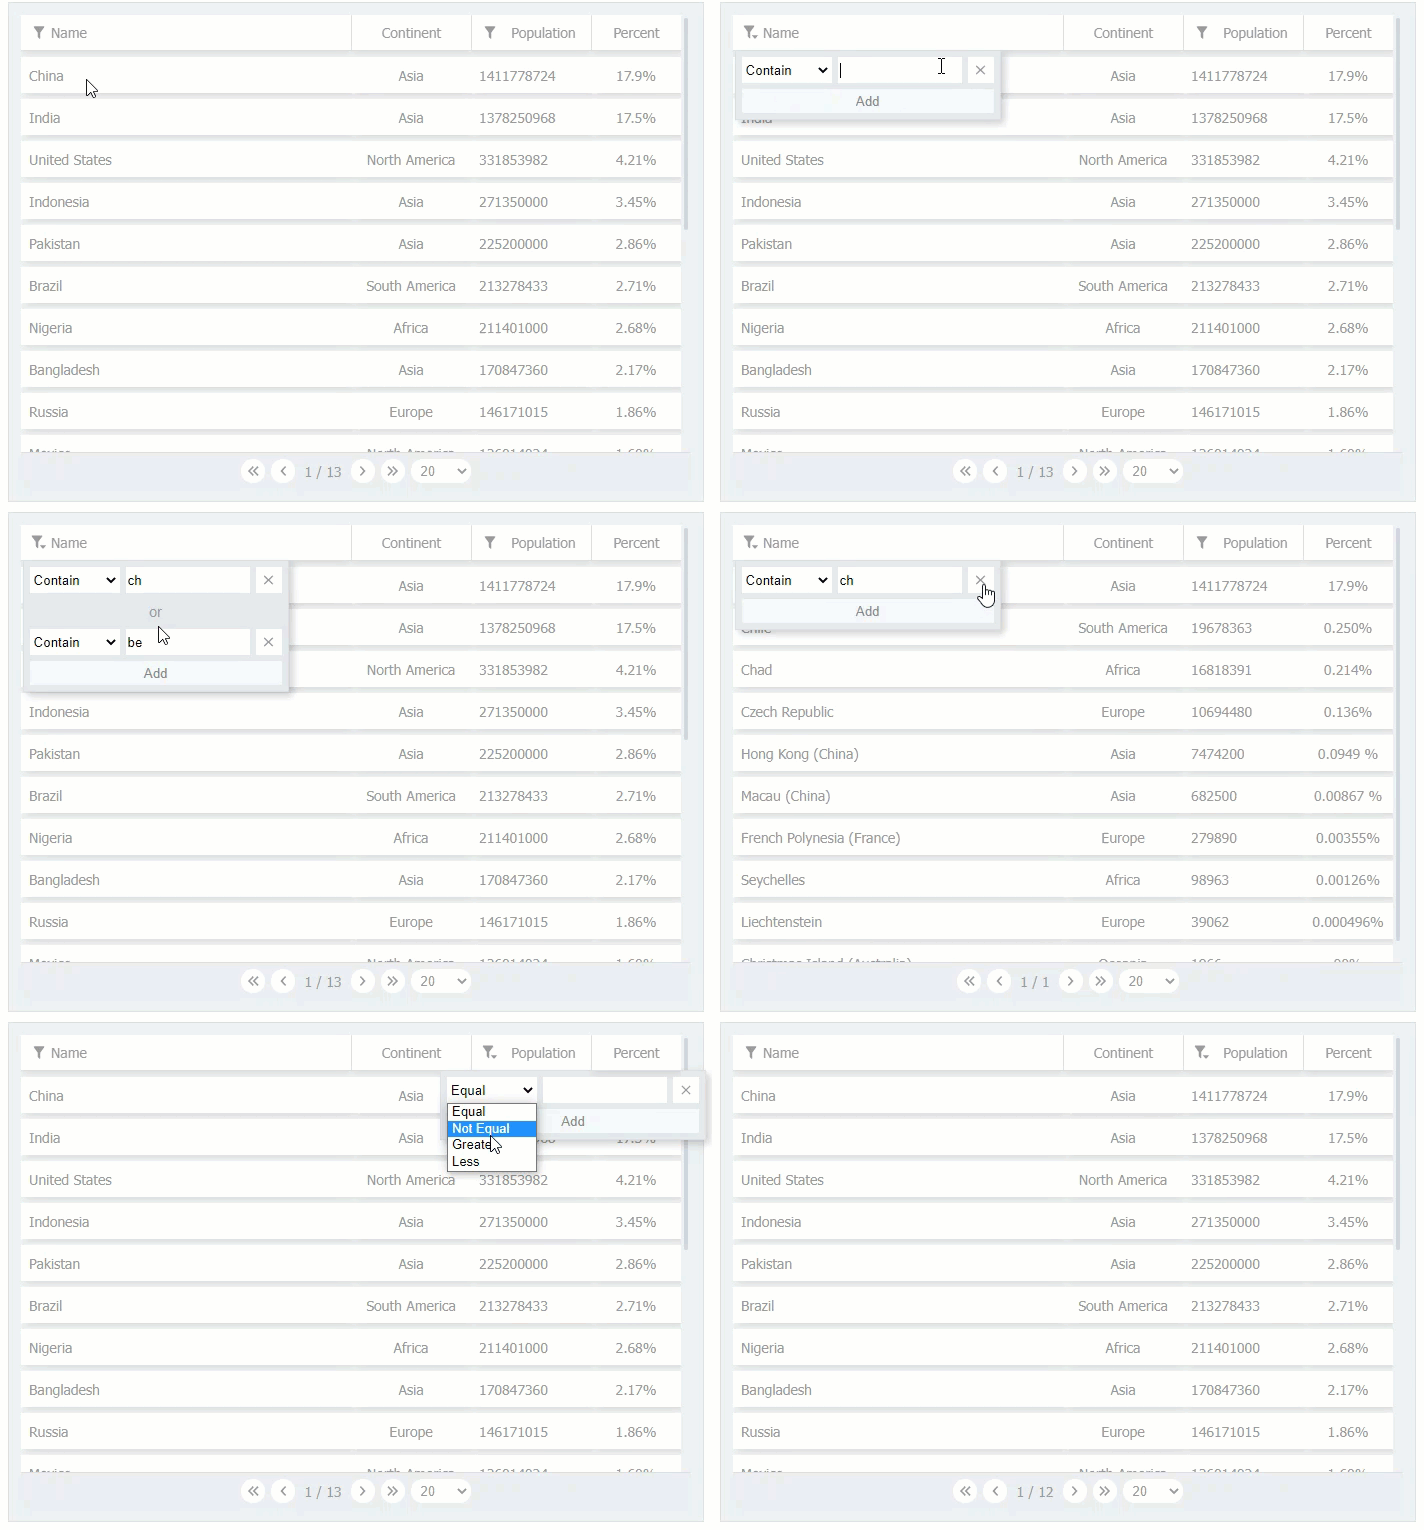
if you want to filter rows outside of aio table , you can set onChangeFilter props (for example server side filtering)
<Table
  ...
  onChangeFilter={(filters)=>{
    ....
  }}
  ...
/>
filters is an array of objects . each object has 3 property (booleanType,items,column)
set paging (object)
paging rows.
properties:
| property |
Type |
Default |
Description |
| sizes |
Array |
[1,5,10,20,30] |
page sizes (dropdown) |
| size |
number |
first index of sizes property |
rows count per page |
| number |
number |
1 |
page number |
| onChange |
function |
Optional |
if you set onChange , you must paging rows of model in parent component and aio table will not paging rows automatically |
onChange function get changed paging object as parameters
<Table
  ...
  paging={{
    number:1,
    sizes:[5,10,15,20],
    size:10,
    onChange:(paging)=>{
      //change model props
      //if not set onChange , paging will be automatically on model
    }
  }}
  ...
/>
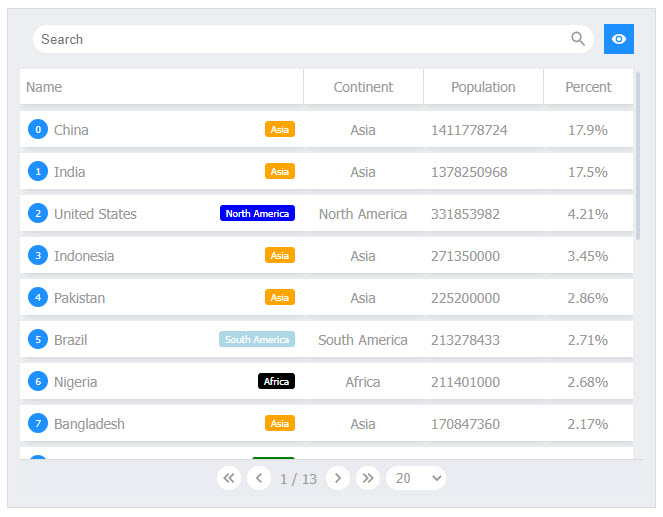
Set column before and after (function)
set html before and after cells of column content.
<Table
  ...
  columns={[
    ...
    {
      title:'Name',
      getValue:(row)=>row.name,
      before:(row)=>{
        return (
          <div
            style={{
              background:'dodgerblue',
              color:'#fff',
              borderRadius:'100%',
              width:20,
              height:20,
              display:'flex',
              alignItems:'center',
              justifyContent:'center',
              fontSize:10
            }}
          >{row._index}</div>
        )
      },
      after:(row)=>{
        var colors = {
          'Asia':'orange','North America':'blue','South America':'lightblue','Africa':'black','Europe':'green'
        }
        return (
          <div
            style={{
              background:colors[row.continent],
              color:'#fff',
              padding:'0 6px',
              height:'16px',
              fontSize:'10px',
              lineHeight:'16px',
              textAlign:'center',
              borderRadius:'3px'
            }}
          >{row.continent}</div>
        )
      }
    },
    ...
  ]}
  ...
/>
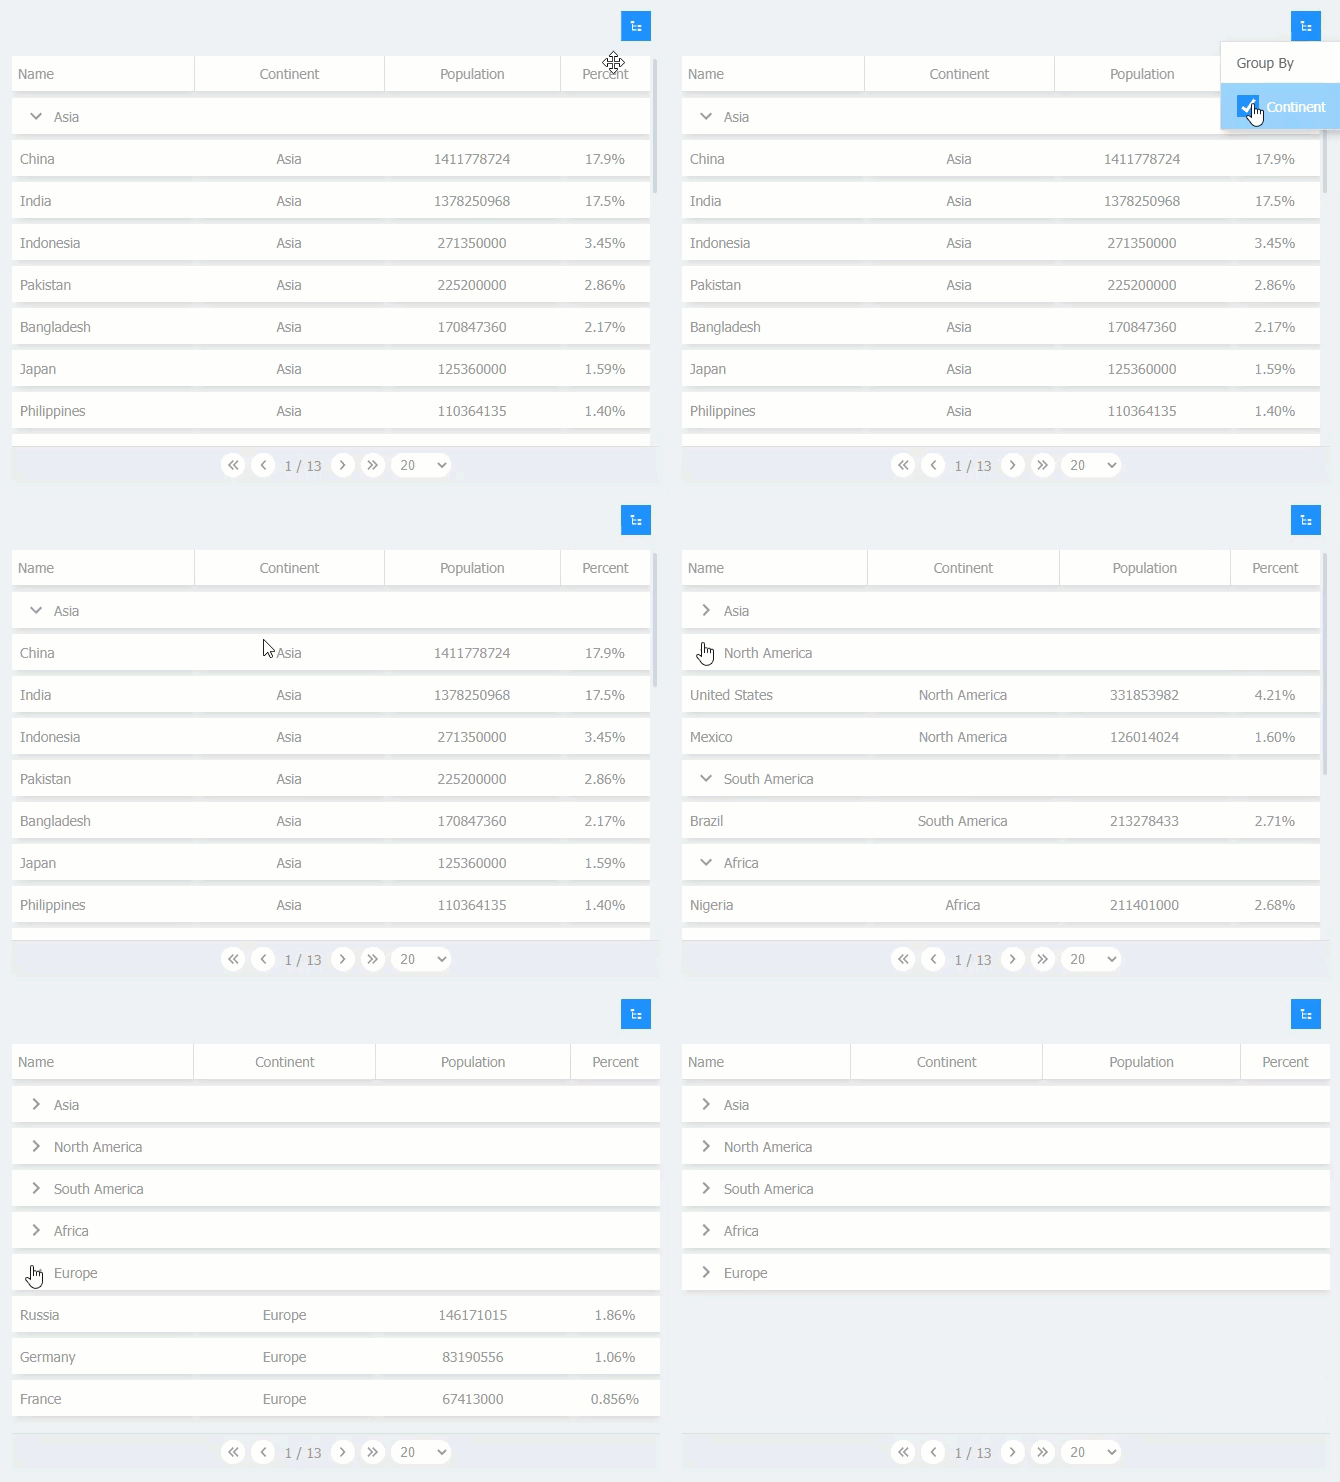
Set groups (Array Of Objects)
group by rows.
each group properties:
| Property |
Type |
Default |
Description |
| title |
string |
Required |
uniqe title of group item |
| getValue |
function |
Required |
this function get (row) as parameter and return a value category for group by rows. |
| active |
boolean |
true |
active or deactive group item. |
| toggle |
boolean |
true |
if true, user can toggle activity of group item from toolbar |
<Table
  ...
  groups:[
     {
        title:'Continent',
        getValue:(row)=>{
          return row.continent;
        }
     }
  }
  ...
/>
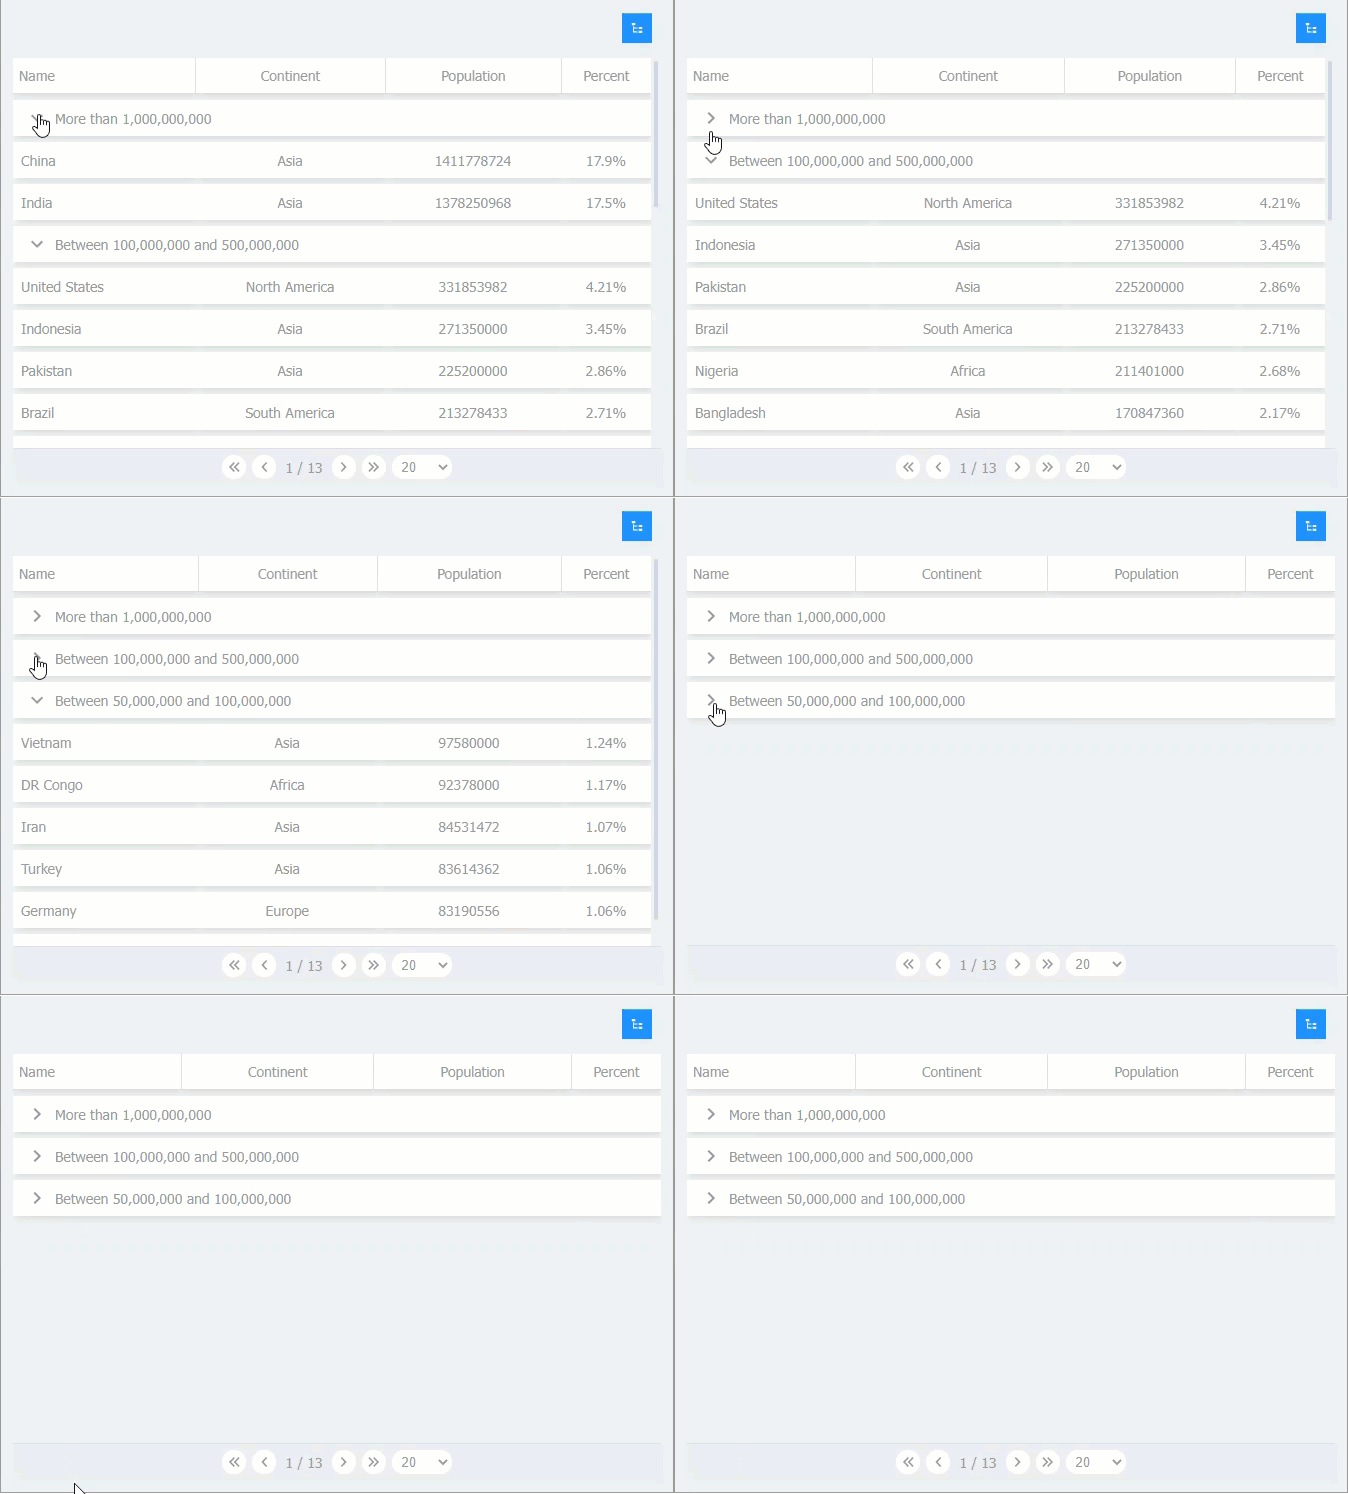
Other Example:
<Table
 ...
 groups={[
   {
     title:'Populatuion',
     getValue:(row)=>{
       if(row.population > 1000000000){
         return 'More than 1,000,000,000'
       }
       if(row.population > 500000000){
         return 'Between 500,000,000 and 1,000,000,000'
       }
       if(row.population > 100000000){
         return 'Between 100,000,000 and 500,000,000'
       }
       if(row.population > 50000000){
         return 'Between 50,000,000 and 100,000,000'
       }
       if(row.population > 25000000){
         return 'Between 25,000,000 and 50,000,000'
       }
       return 'Less Than 25,000,000'
     }
   }
 ]}
 ...
/>
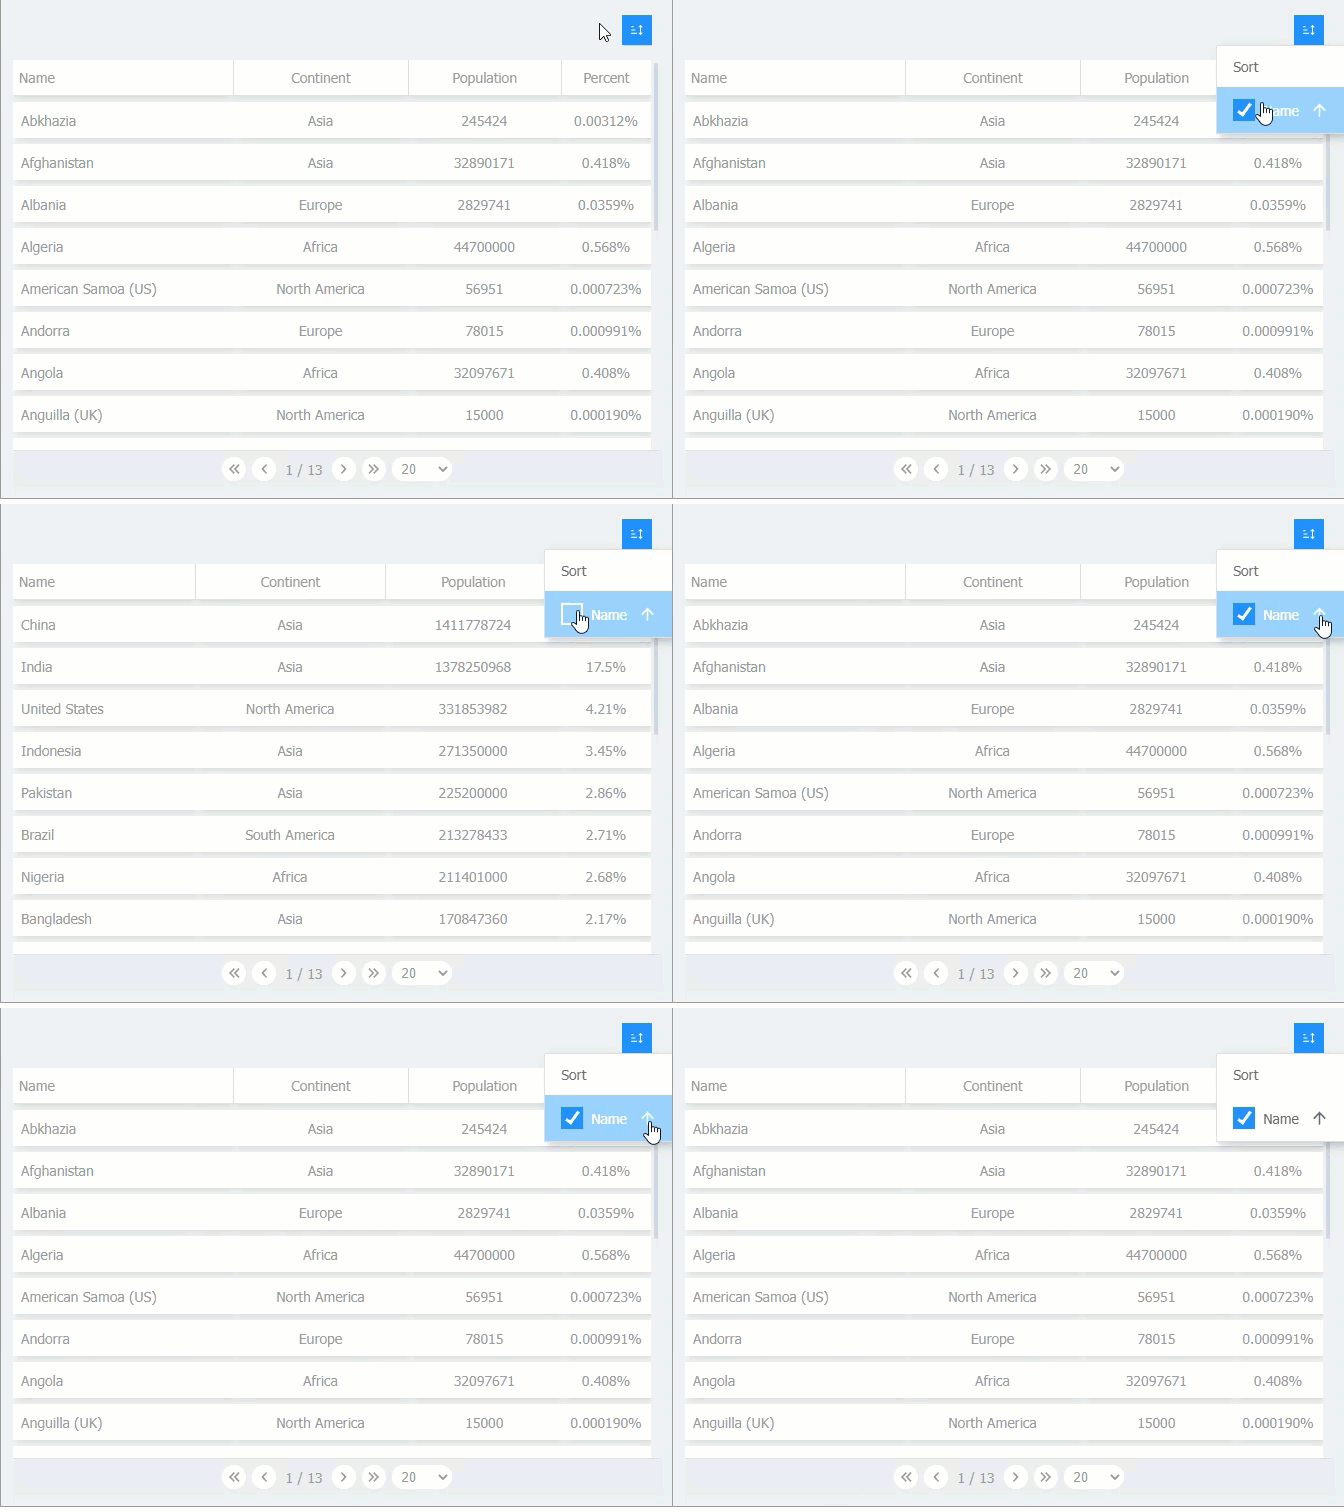
Set sorts (Array Of Objects)
sort rows.
each sort properties:
| Property |
Type |
Default |
Description |
| title |
string |
Required |
uniqe title of sort item |
| getValue |
function |
Required |
this function get (row) as parameter and return a value for sort rows. |
| type |
string ('inc' or 'dec') |
'inc' |
set sort type as increase or decrease. |
| active |
boolean |
true |
active or deactive sort item. |
| toggle |
boolean |
true |
if true, user can toggle activity of sort item from toolbar |
<Table
  ...
  sorts={[
    {
      title:'Name',
      getValue:(row)=>row.name,
      type:'inc'
    }
  ]}
  ...
/>
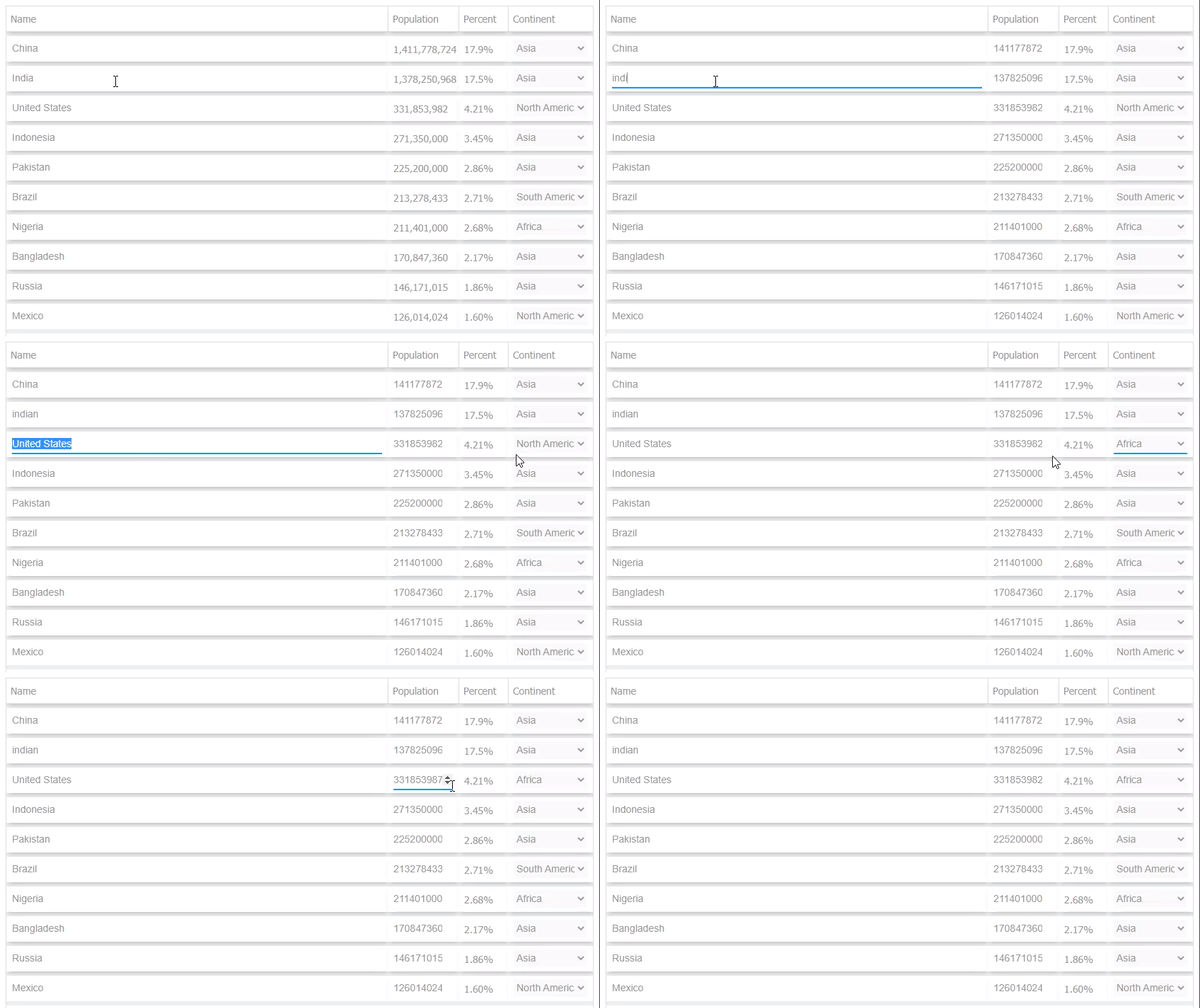
Set column inlineEdit (Objects)
inline editing cells.
inlineEdit properties:
| Property |
Type |
Default |
Description |
| type |
'text' or 'number' or 'select' |
'text' |
type of inline edit input. |
| disabled |
function |
Optional |
get row as parameter and return boolean. if return true this cell input will be disabled. |
| options |
array of objects |
required if type is 'select' |
options of inline edit input by select type (each option have 2 property(text,value)). |
| onChange |
function |
required |
get row and value as parameters. if return an string means there is an error and cell will show this string as error message. |
<Table
  ...
  columns={[
    {
      title:'Name',
      getValue:(row)=>row.name,
      width:'auto',
      inlineEdit:{
        type:'text',
        onChange:(row,value)=>{
          row.name = value;
          this.setState({model:this.state.model})
        }
      }
    },
    {
      title:'Population',resizable:true,
      getValue:(row)=>row.population,
      template:(row)=>numberWithCommas(row.population),
      width:'100px',
      inlineEdit:{
        type:'number',
        onChange:(row,value)=>{
          row.population = value;
          this.setState({model:this.state.model})
        }
      }
    },
    {
      title:'Percent',
      getValue:(row)=>row.percent,
      template:(row)=>row.percent + '%',
      width:'70px'
    },
    {
      title:'Continent',
      getValue:(row)=>row.continent,
      width:'120px',
      inlineEdit:{
        type:'select',
        options:[
          {text:'Asia',value:'Asia'},
          {text:'Africa',value:'Africa'},
          {text:'Europa',value:'Europa'},
          {text:'North America',value:'North America'},
          {text:'South America',value:'South America'}
        ],
        onChange:(row,value)=>{
          row.continent = value;
          this.setState({model:this.state.model})
        }
      }
    }
  ]}
  ...
/>
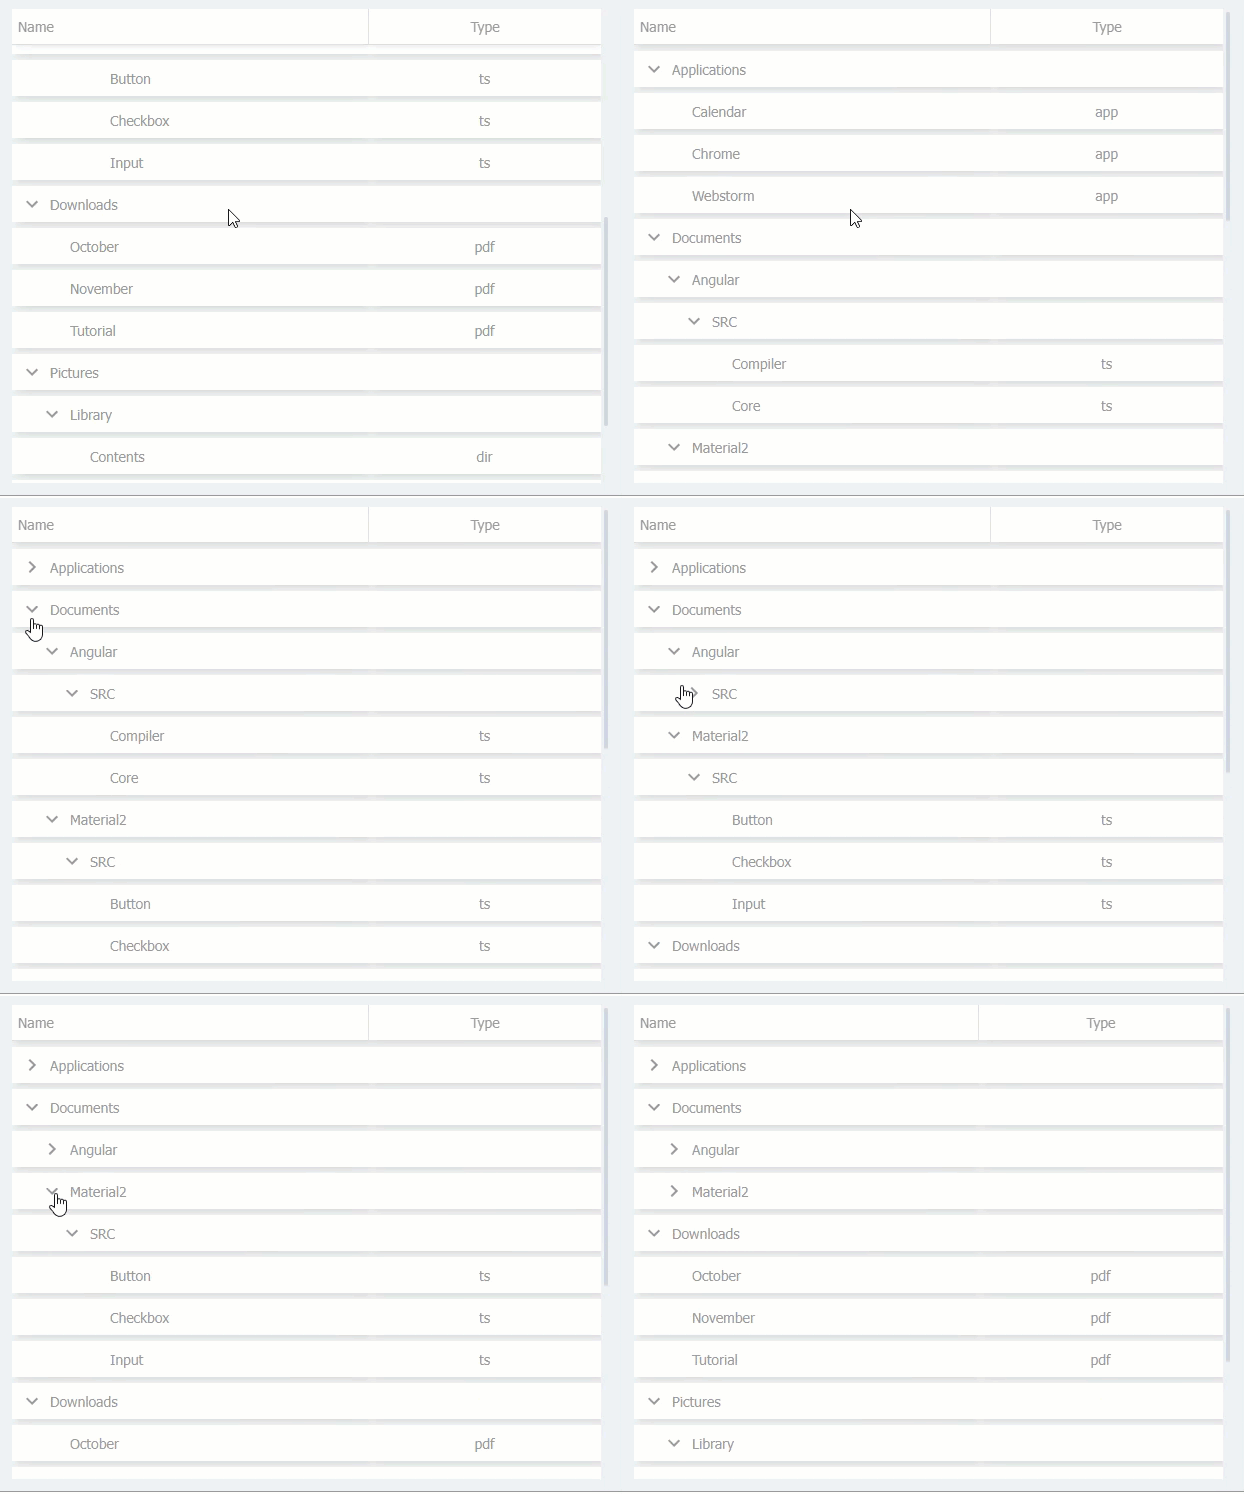
Tree data (nested json)
nested json example:
let nestedData = [
  {
    name:'Applications',id:'1',
    childs:[
      {name:'Calendar',id:'2',type:'app'},
      {name:'Chrome',id:'3',type:'app'},
      {name:'Webstorm',id:'4',type:'app'}
    ]
  },
  {
    name:'Documents',id:'5',
    childs:[
      {
        name:'Angular',id:'6',
        childs:[
          {
            name:'SRC',id:'7',
            childs:[
              {name:'Compiler',id:'8',type:'ts'},
              {name:'Core',id:'9',type:'ts'},
            ]
          },
        ]
      },
      {
        name:'Material2',id:'10',
        childs:[
          {
            name:'SRC',id:'11',
            childs:[
              {name:'Button',id:'12',type:'ts'},
              {name:'Checkbox',id:'13',type:'ts'},
              {name:'Input',id:'14',type:'ts'}
            ]
          }
        ]
      },
    ]
  },
  {
    name:'Downloads',id:'15',
    childs:[
      {name:'October',id:'16',type:'pdf'},
      {name:'November',id:'17',type:'pdf'},
      {name:'Tutorial',id:'18',type:'pdf'}
    ]
  },
  {
    name:'Pictures',id:'19',
    childs:[
      {
        name:'Library',id:'20',
        childs:[
          {name:'Contents',id:'21',type:'dir'},
          {name:'Pictures',id:'22',type:'dir'}
        ]
      },
      {name:'Sun',id:'23',type:'png'},
      {name:'Woods',id:'24',type:'jpg'}
    ]
  }
]
set getRowChilds function for get rows childs.
set column treeMode for collapse and indent rows.
export default class App extends Component {
  render(){
    return (
      <Table
        className='table'
        model={nestedData}
        columns={[
          {
            title:'Name',
            getValue:(row)=>row.name,
            justify:false,
            titleJustify:false,
            treeMode:true
          },
          {
            title:'Type',
            getValue:(row)=>row.type
          }
        ]}
        getRowChilds={(row)=>row.childs}
      />
    );
  }
}
Tree data (flat json)
data as array with id and parent id.
flat json example:
let flatData = [
  {name:'Applications',id:'1'},
  {name:'Calendar',id:'2',type:'app',parentId:'1'},
  {name:'Chrome',id:'3',type:'app',parentId:'1'},
  {name:'Webstorm',id:'4',type:'app',parentId:'1'},
  {name:'Documents',id:'5'},
  {name:'Angular',id:'6',parentId:'5'},
  {name:'SRC',id:'7',parentId:'6'},
  {name:'Compiler',id:'8',type:'ts',parentId:'7'},
  {name:'Core',id:'9',type:'ts',parentId:'7'},
  {name:'Material2',id:'10',parentId:'5'},
  {name:'SRC',id:'11',parentId:'10'},
  {name:'Button',id:'12',type:'ts',parentId:'11'},
  {name:'Checkbox',id:'13',type:'ts',parentId:'11'},
  {name:'Input',id:'14',type:'ts',parentId:'11'},
  {name:'Downloads',id:'15'},
  {name:'October',id:'16',type:'pdf',parentId:'15'},
  {name:'November',id:'17',type:'pdf',parentId:'15'},
  {name:'Tutorial',id:'18',type:'pdf',parentId:'15'},
  {name:'Pictures',id:'19'},
  {name:'Library',id:'20',parentId:'19'},
  {name:'Contents',id:'21',type:'dir',parentId:'20'},
  {name:'Pictures',id:'22',type:'dir',parentId:'20'},
  {name:'Sun',id:'23',type:'png',parentId:'19'},
  {name:'Woods',id:'24',type:'jpg',parentId:'19'}
]
set getRowParentId function for get rows parent id.
set getRowId function for get rows id.
set column treeMode for collapse and indent rows.
export default class App extends Component {
  render(){
    return (
      <Table
        className='table'
        model={flatData}
        columns={[
          {
            title:'Name',
            getValue:(row)=>row.name,
            justify:false,
            titleJustify:false,
            treeMode:true
          },
          {
            title:'Type',
            getValue:(row)=>row.type
          }
        ]}
        getRowId={(row)=>row.id}
        getRowParentId={(row)=>row.parentId}
      />
    );
  }
}
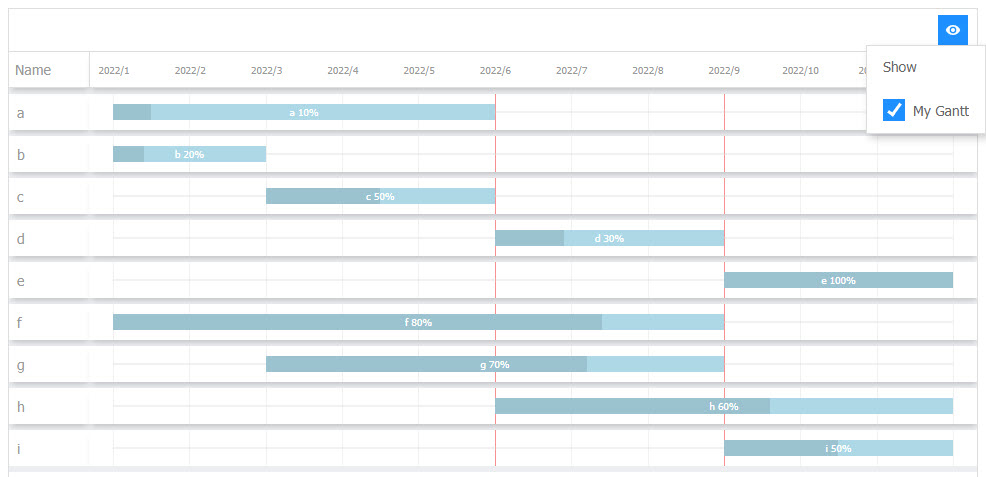
Gantt chrt example
for set column as gantt chart , you can set a column by template:'gantt'.
gantt column can have all column properties and must have this properties:
| Property |
Type |
Default |
Description |
| template |
string('gantt') |
Required |
define column as gantt. |
| getKeys |
function |
Required |
return gantt keys array. |
| getStart |
function |
required |
get row a parameter and return an string as start of row bar(one of keys). |
| getEnd |
function |
required |
get row a parameter and return an string as end of row bar(one of keys). |
| getProgress |
function |
Optional |
get row as parameter and return a number between 0 and 100 to show row percentage graphically. |
| getText |
function |
Optional |
get row as parameter and return an string to show on row gantt bar. |
| padding |
string(px) |
'36px' |
gantt horizontal padding. |
| getBackgroundColor |
function |
a function that return '#69bedb' |
get row as parameter and return an string as gant bar background color. |
| getColor |
function |
a function that return '#fff' |
get row as parameter and return an string as gant bar text color. |
| getFlags |
function |
Optional |
return an array of objects (Examplae [{color:'red',value:'2022/6'}]) as gantt flags. |
export default class App extends Component {
  state = {
    model:[
      {name:'a',startDate:'2022/1',endDate:'2022/6',progress:10},
      {name:'b',startDate:'2022/1',endDate:'2022/3',progress:20},
      {name:'c',startDate:'2022/3',endDate:'2022/6',progress:50},
      {name:'d',startDate:'2022/6',endDate:'2022/9',progress:30},
      {name:'e',startDate:'2022/9',endDate:'2022/12',progress:100},
      {name:'f',startDate:'2022/1',endDate:'2022/9',progress:80},
      {name:'g',startDate:'2022/3',endDate:'2022/9',progress:70},
      {name:'h',startDate:'2022/6',endDate:'2022/12',progress:60},
      {name:'i',startDate:'2022/9',endDate:'2022/12',progress:50},
    ]
  }
  render(){
    var {model} = this.state;
    return (
      <Table
        model={model}
        columns={[
          {
            title:'Name',
            getValue:(row)=>row.name,
            width:'80px',
          },
          {
            title:'My Gantt',
            minWidth:'400px',
            toggleShow:true,

            template:'gantt',
            getStart:(row)=>row.startDate,
            getEnd:(row)=>row.endDate,
            getKeys:()=>['2022/1','2022/2','2022/3','2022/4','2022/5','2022/6','2022/7','2022/8','2022/9','2022/10','2022/11','2022/12'],
            getProgress:(row)=>row.progress,
            getText:(row)=>row.name + ' ' + row.progress + '%',
            padding:'24px',
            getBackgroundColor:(row)=>'lightblue',
            getColor:(row)=>'#fff',
            getFlags:()=>[
              {color:'red',value:'2022/6'},
              {color:'red',value:'2022/9'},
            ]
          }
        ]}
      />
    );
  }
}