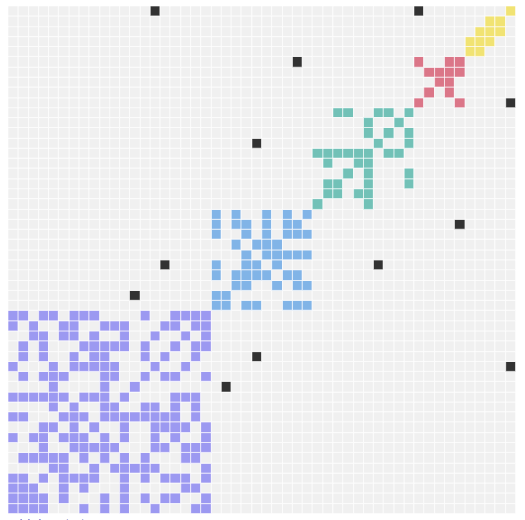
Lightning Adjcency
Adjacency plot for Lightning
Documentation and examples at lightning-viz.org
Usage options
Lightning server
The Lightning server provides API-based access to reproducible, web-based visualizations. It can be deployed in many ways, including Heroku, Docker, a public server, a local app for OS X — and even a server-less version well-suited to notebooks like Jupyter. It comes bundled with a core set of visualizations, but is built to support custom ones.
Read more about getting started with a Lightning server
You can create an adjacency visualization using Python, Scala, JavaScript, or R by using API clients for making requests to a Lightning server.
Clients
Take a look at each client for installation and usage examples:
Python adjacency example
from lightning import Lightningfrom numpy import random lgn = mat = = 0group = ( * 5). Scala adjacency example
import org.viz.lightning._import scala.util.Random val lgn = Lightning() val mat = Array.fill(10)(Array.fill(10)(Random.nextDouble()).map{ d => if (d < 0.75) { d } else { 0.0 }})val group = Array.fill(10)(Random.nextInt) lgn.adjacency(mat, group=group)JavaScript module via npm
lightning-adjacency is an npm module that can be used on its own.
Install as JavaScript module
npm i --save lightning-adjacency
Example
var Adjacency = ; var el = document;documentbody; var data = nodes: 0 1 2 3 4 5 6 7 8 9 10 group: 0 0 1 1 1 1 2 2 2 2 2 links: 0 1 1 0 2 1 1 3 3 5 6 4 7 9 2 labels: "name 0" "name 1" "name 2" "name 3" "name 4" "name 5" "name 6" "name 7" "name 8" "name 9" "name 10"; var options = numbers: true symmetric: true sort: 'group' width: 600 height: 400; var adjacency = el data options;API
var Adjacency = require('lightning-adjacency');
var adjacency = new Adjacency(selector, data, options);
Arguments:
- selector – css selector or dom node that will act as parent node of the visualization
- data – the required data for the Visualization
- nodes – array representing nodes in the visualization
- group – array representing groups
- links – array of arrays describing the links between nodes
- labels – array of strings
- options
- width – Number – the width of the visualization
- height – Number – the height of the visualization
- numbers – Boolean – Set to
trueto show numbers in cells of the visualization. Default:false - symmetric – Boolean –
- sort – can be either
groupordegree