This nilgiri-performance module integrates the power of the K6 performance testing framework with AI-driven insights to simplify and enhance performance testing. It provides an intuitive interface to configure key test parameters, such as the URL, virtual users (VUs), and test duration. Once the tests are executed, AI analyzes the results to generate comprehensive performance reports, enabling a deeper understanding of product efficiency and scalability. Perfect for teams aiming to automate and elevate their performance testing workflows.
Before we go to Setup Lets See what are the prerequisites
-
Ensure you have Node.js and TypeScript installed on your machine.
- You can download Node.js from here.
- To install TypeScript globally, run the following command:
npm install -g typescript
-
K6: Make sure K6 is installed on your system.
-
IDE: This project is written in TypeScript, so you'll need to IDE Which Supports NodeJs, For Example : VScode , Intelli ,Etc.
-
AI API Key and EndPoint: This Project is AI-driven,Hence User are requested to get ready with AI API Auth Key and End Point .
Note : Below two steps is for Creating new Project , if you alreday project then please ignore the below two steps
Create a New Node.js Project (If Needed)
If you don’t have a Node.js project yet, follow these steps:
Create a new project folder:
mkdir my-performance-project && cd my-performance-projectInitialize a new Node.js project:
npm init -y-
Install the Dependency:
npm install performancenilgiri --save -d
Running the Application
To run the runK6Test method, import and call it in your script:
Example: Create new testFile.tsfile and copy paste the below example code ,
replace your reportPath, AiUrl and apikey with correct values .
import { runK6Test } from 'nilgiriperformance';

const testConfig = {
  url: "https://example.com",
  options: {
    vus: 10,
    duration: "30s"
  },
  aireport: {
    reportPath: "./performance_report.html",
    AiUrl: "https://ai-analysis-api.com",
    apikey: "your-api-key"
  },
  detailedReportjson: "./performance_metrics.json"
};

runK6Test(testConfig)
  .then(() => console.log('Performance test completed successfully!'))
.catch(err => console.error('Error:', err));| Parameter | Type | Description | Example |
|---|---|---|---|
url |
string | The target URL for performance testing. | 'https://example.com' |
options |
object | K6 test options (VU[virtual users] count, duration, etc.). | { vus: 10, duration: '30s' } |
aireport |
object | AI report configuration. | { reportPath: './report.html', AiUrl: '...' } |
aireport.reportPath |
string | Path to save the AI-generated performance report. | './ai_report.html' |
aireport.AiUrl |
string | AI API endpoint for performance analysis. | 'https://ai-analysis-api.com' |
aireport.apikey |
string | API key for AI service authentication. | 'your-api-key' |
detailedReportjson |
string (optional) | Path to save a detailed JSON performance report. | './performance_metrics.json' |
-
Compile the TypeScript file:
In your terminal, navigate to the project folder and run the following command to compile the TypeScript file:
tsc testFile.ts
node testFile.js
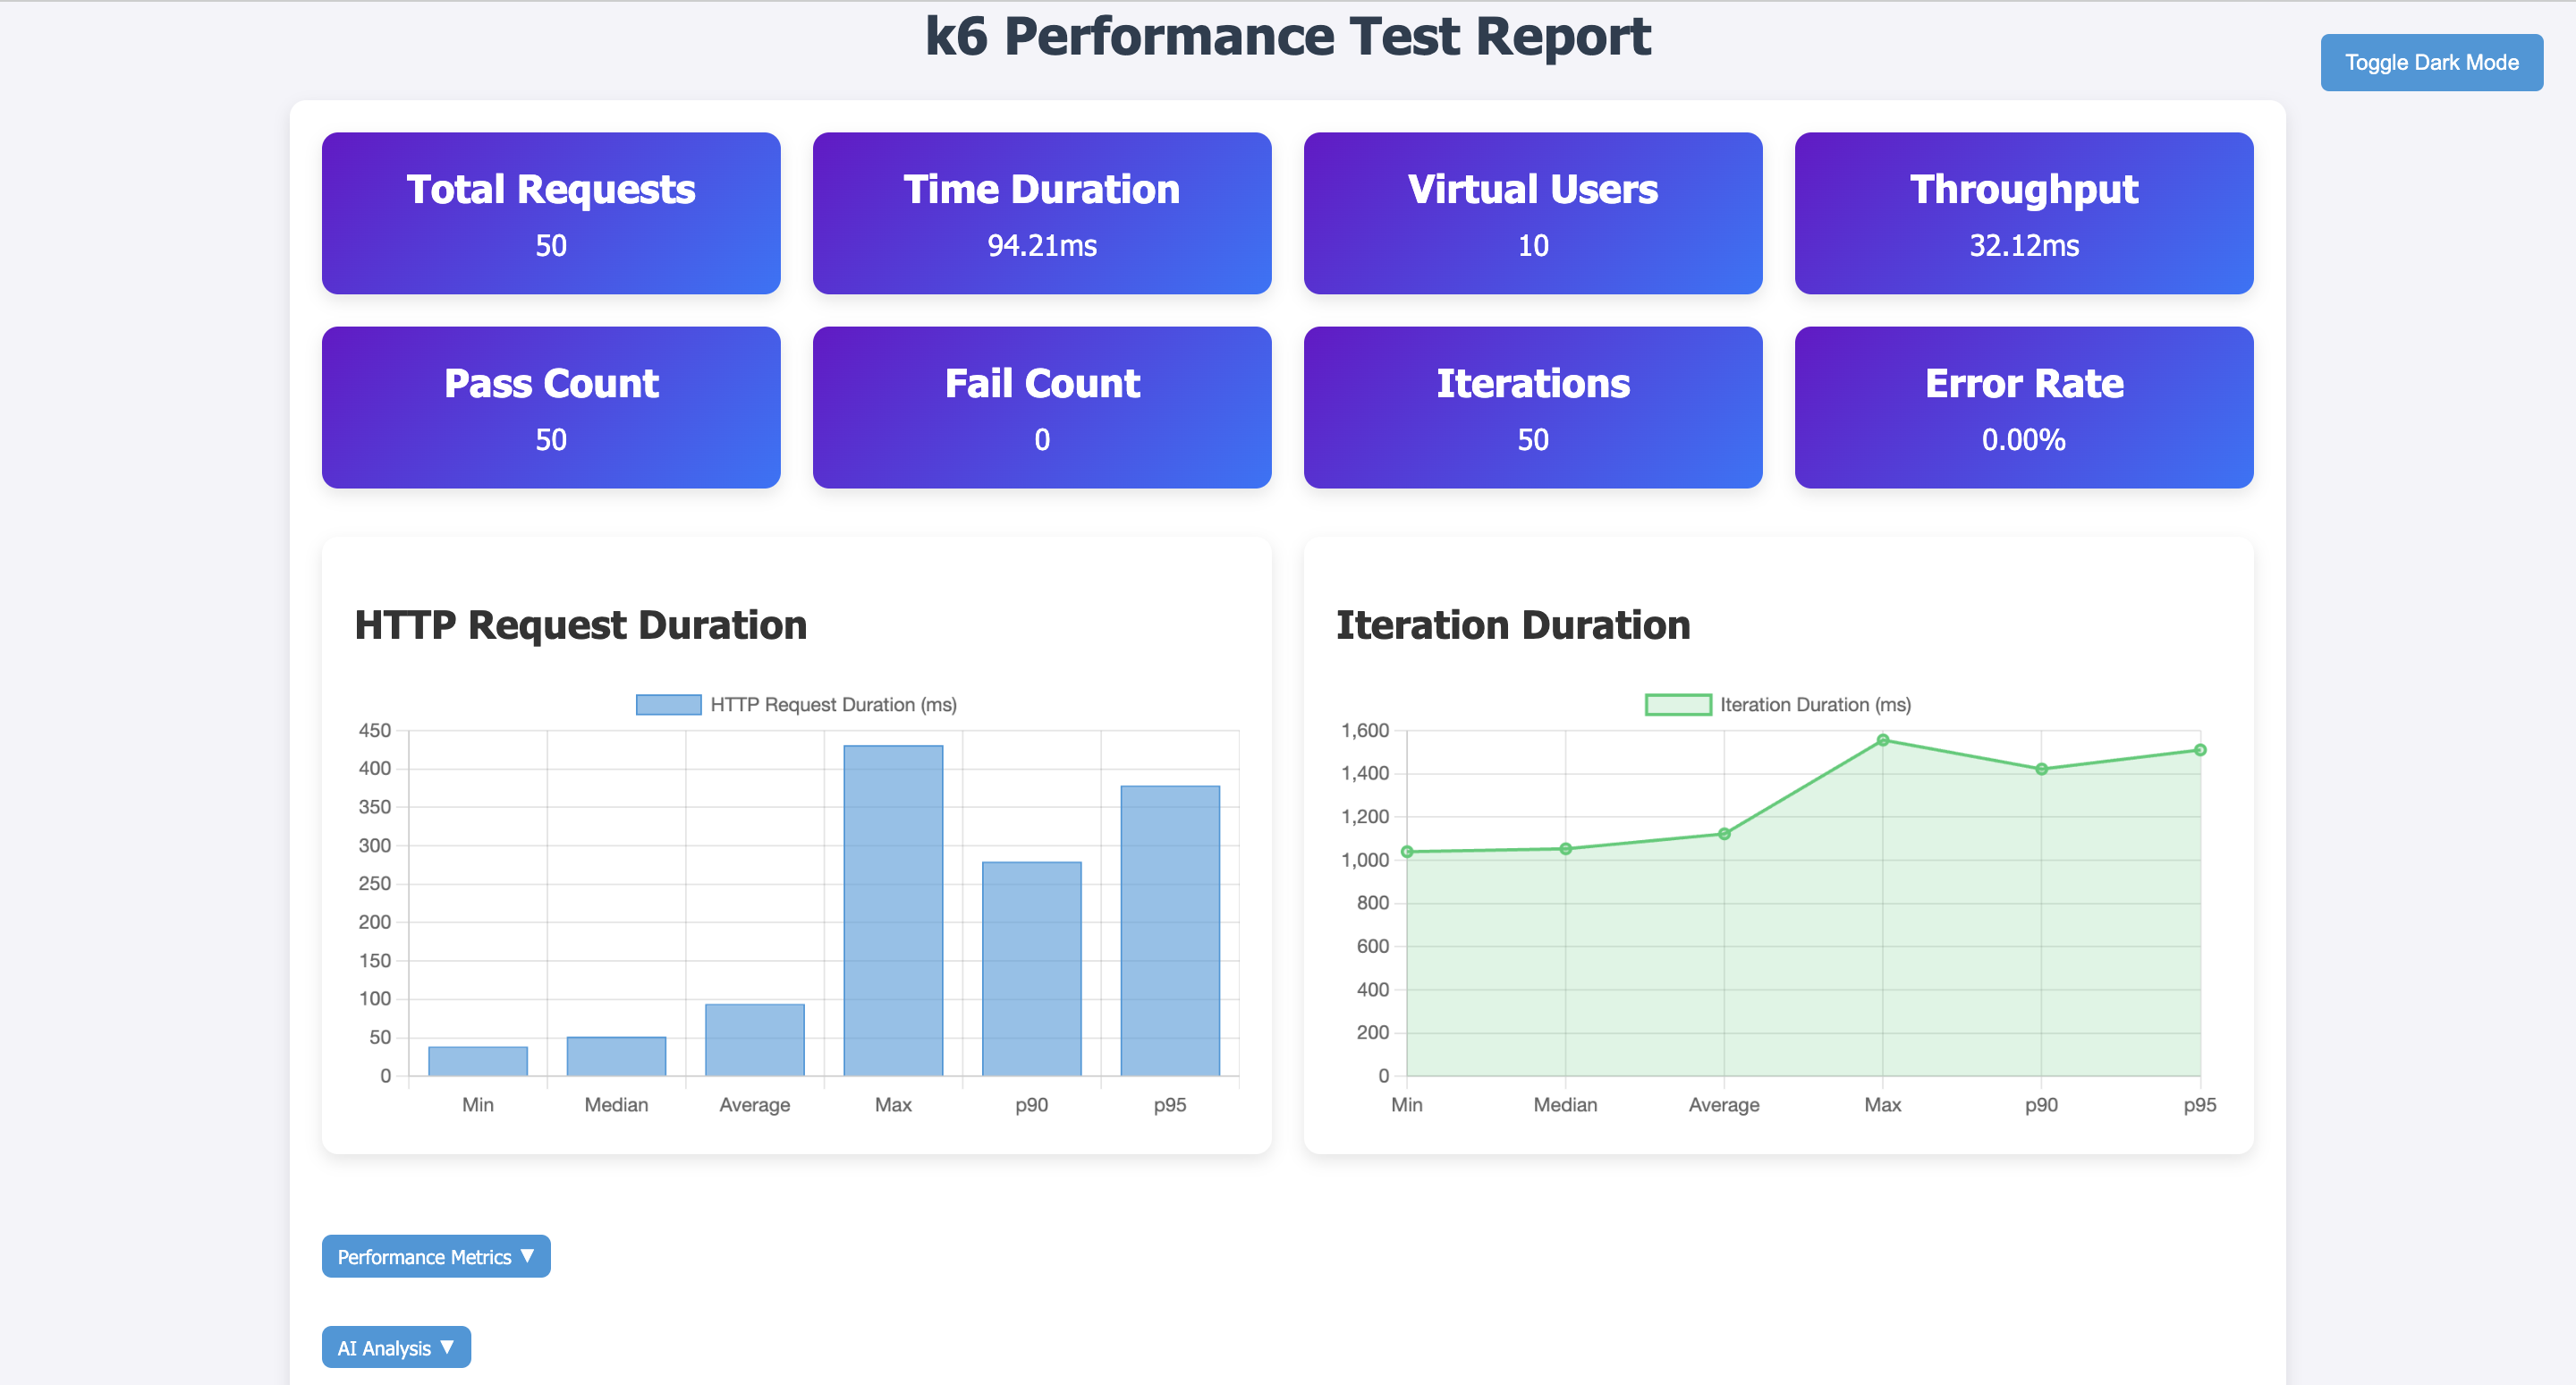
The K6 Performance Test Report provides a comprehensive analysis of your application's performance based on simulated user traffic. The report is designed to help developers, testers, and stakeholders understand key performance metrics in a visually intuitive format.
The report displays high-level performance indicators in colored tiles at the top, offering a quick glance at critical statistics:
| Metric | Description |
|---|---|
| Total Requests | Total number of HTTP requests executed during the test. |
| Time Duration | The total execution time of the test. |
| Virtual Users | Number of concurrent users simulated during the test. |
| Throughput | The rate at which requests were processed per second. |
| Pass Count | Number of successful requests (HTTP 200 status). |
| Fail Count | Number of failed requests due to errors or timeouts. |
| Iterations | Number of times the test script was executed. |
| Error Rate | Percentage of failed requests compared to total requests. |
Below the summary tiles, the report provides two visual representations of performance trends using bar and line charts.
This chart displays the distribution of HTTP response times across different statistical metrics:
- Min, Median, Average – Represent baseline response times.
- Max – The slowest request recorded during the test.
- p90, p95 – The 90th and 95th percentile values, indicating the response time thresholds below which 90% or 95% of requests completed.
A high max response time or p95 value suggests potential performance bottlenecks. Optimizing server response times, caching strategies, or load balancing might be necessary.
This chart represents the time taken for each test iteration over different statistical points:
- Min, Median, Average – General test execution time trends.
- Max, p90, p95 – Indicators of performance spikes.
A steadily increasing trend may indicate performance degradation over time, possibly due to memory leaks, inefficient resource management, or increasing server load.
🔹 Performance Metrics Dropdown
Expands to provide a more detailed breakdown of test execution times and resource utilization.
🔹 AI Analysis Dropdown
Since this report AI-powered analysis is enabled, this section offers automated insights and recommendations to optimize performance based on test results.
- Identify potential bottlenecks by analyzing high response times and failure rates.
- Compare p90/p95 percentiles against expected SLAs (Service Level Agreements).
- Use AI-generated insights (if enabled) to apply recommended optimizations.
- Adjust test configurations (e.g., increasing virtual users) to simulate real-world scenarios accurately.
- Interactive CLI to define K6 test parameters
- Supports optional iterations, delays, and ramp-up stages
- Runs the K6 test and exports the summary as
detailedReport.json - Analyzes the K6 test summary and generates a report
- Uses AI to analyze performance metrics and generate insights
- For any Support please feel free to drop your query at
- nilgiri-performance GitHub repository.
Thank you for choosing nilgiri-performance as part of the Nilgiri framework for your Node.js utility needs!
Copyright (c) 2025 Tricon Infotech


