Inspired by ActionScript's "Disable Trace Comments On Publish" setting, I wanted a way to be able to have copious amounts of console logs (if need be) for development, but not have them output when you were ready to make it live or ship it to the client. I would create the logs, use the logs and then either comment them all out, or delete them. And as long as no updates ever needed to be made that was fine. But anytime a change/enhancement was requested I would have to uncomment, or recreate, the log for development purposes again. As I was creating the first version of this more and more enhancements came to mind and is now what is included in the package.
This allows you to more easily see the variables, strings, and objects that you wish to print out in the Developer's Tool console. It returns a "pretty print" version of what you would console log.
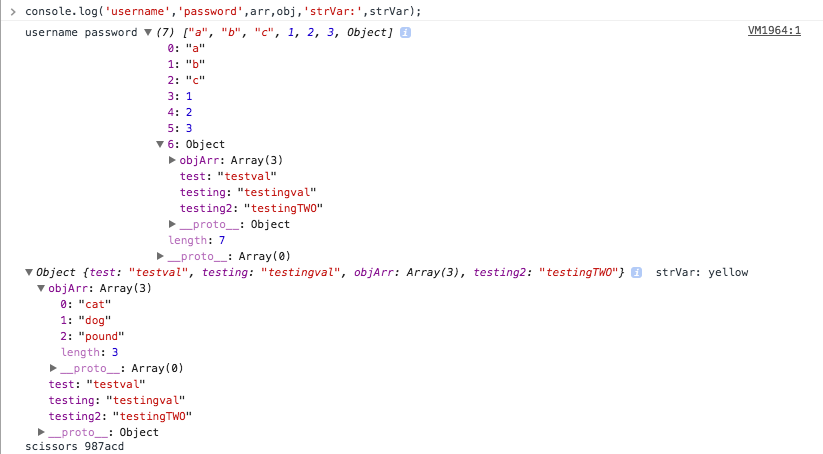
With the built in console.log method you would see something along the lines of:

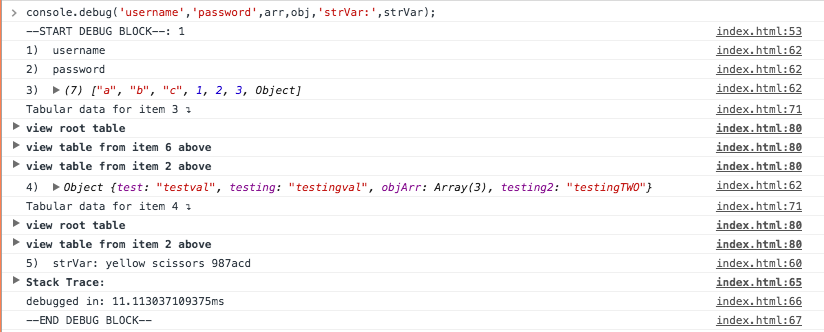
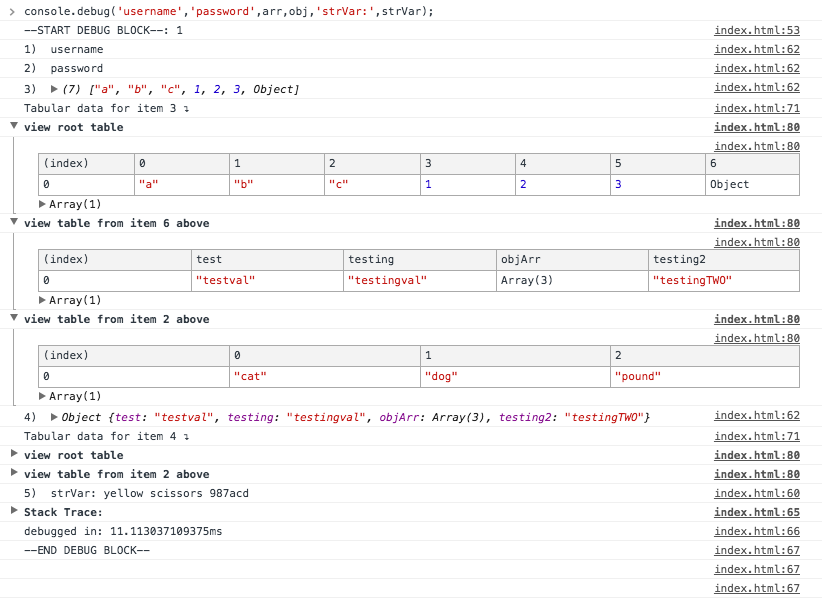
With the qonsole.debug method you will see something along the lines of:

npm install qonsole --save
or
yarn add qonsole
You can also grab a version of the package for purely front-end use from github. Install it as you would any other external javascript file using the <script src=""></script> tags. That version is available here: https://github.com/mlnck/Qonsole/blob/master/web/debug.js
Import the script into your page.
That will allow you access to the qonsole.debug method.
By default each item that you log will be logged on its own line.
There will be recursively nested tables that display for each array and object within the item.
In addition to displaying the format using console.log you can also specify to use info, warn, or error.
You do this by passing the display option as the first argument:
qonsole.debug(qonsole.WARN,'username','password',arr,obj,'strVar:',strVar);The options are:
- qonsole.LOG (default)
- qonsole.INFO
- qonsole.ERROR
- qonsole.WARN
You are also able to globally set the log level for all output using qonsole.debug.
You do this by calling using the setLogLevel method.
qonsole.setLogLevel(qonsole.DEBUG);The options are:
- qonsole.DEBUG (default)
- qonsole.NORM (displays the generic console.log method)
- qonsole.PROD (suppresses all logging)
If you want to override the log level for a single console statement, you can do so by chaining the isLevel method to the beginning of the debug method.
  qonsole.setLogLevel(qonsole.PROD);
  qonsole.debug(qonsole.WARN,'username','password',arr,obj,'strVar:',strVar); //will not display due to logLevel being set to "PROD" above
  qonsole.isLevel(qonsole.DEBUG).debug(qonsole.ERROR,'username','password',arr,obj,'strVar:',strVar); //will display using "pretty print" style
Qonsole also supports toggling the logs on a group level. For instance if you had separate components, and each component was labeled as a different group you could allow qonsole to only show the logs from a single component.
//to set the group that the log belongs to just chain the group beforehand:
qonsole.setGroup('group1').debug(qonsole.WARN,'GROUP1 DEBUG GROUP','password',arr,obj,'strVar:');
//setGroup allows you to choose whether to display the message using qonsole.DEBUG(default) or qonsole.NORM
qonsole.setGroup('group1',qonsole.NORM).debug(qonsole.WARN,'GROUP1 NORM GROUP');
qonsole.setGroup('group2').debug('GROUP2 GROUP',);
qonsole.setGroup('group3').debug('GROUP1  GROUP');
Using the above, you would enable the group filtering by setting showGroups before any qonsole.debug calls were made. showGroups expects an array of the groups to display.
qonsole.showGroups(['group1','group3']);Lastly, although it is not fully supported by all browsers, you can enable profiling.
WARNING: This will greatly increase load time and memory usage.
qonsole.DO_PROFILE = true;- There are 2 blank lines after each debug block. This is intentional to help differentiate the individual method calls.
- Due to the qonsole.debug method handling all logging, the line numbers will not match up to where the qonsole.debug method was called in the original javascript code. To handle this, at the end of the DEBUG BLOCK, there is a collapsed Stack Trace: object. If you expand that you can see where the qonsole.debug call originated from.
- If showGroups is used, the default mode is automatically set to qonsole.PROD, allowing only the groups specified in the array to display.

